
What is a “Fake Breakout” in trading?
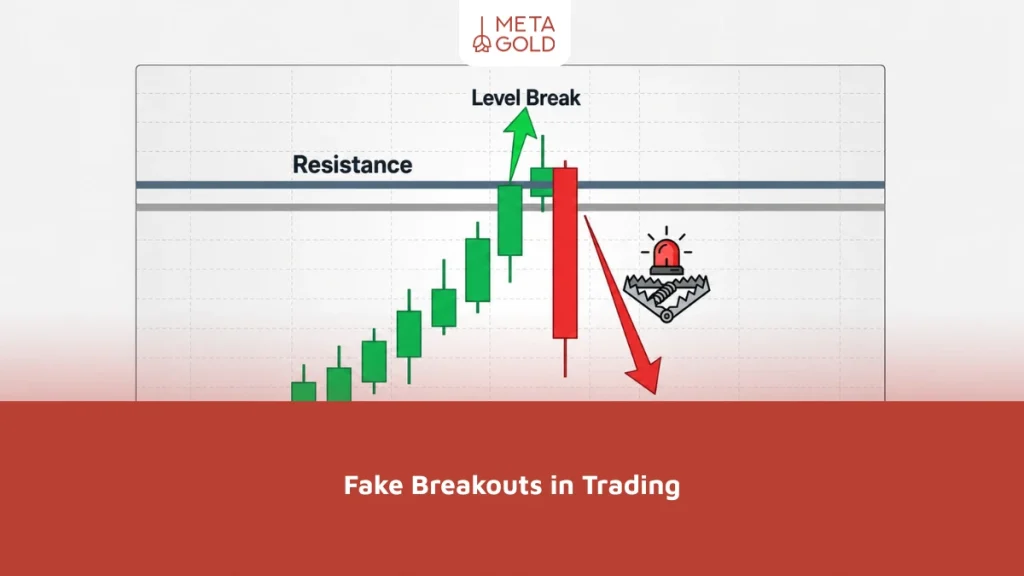
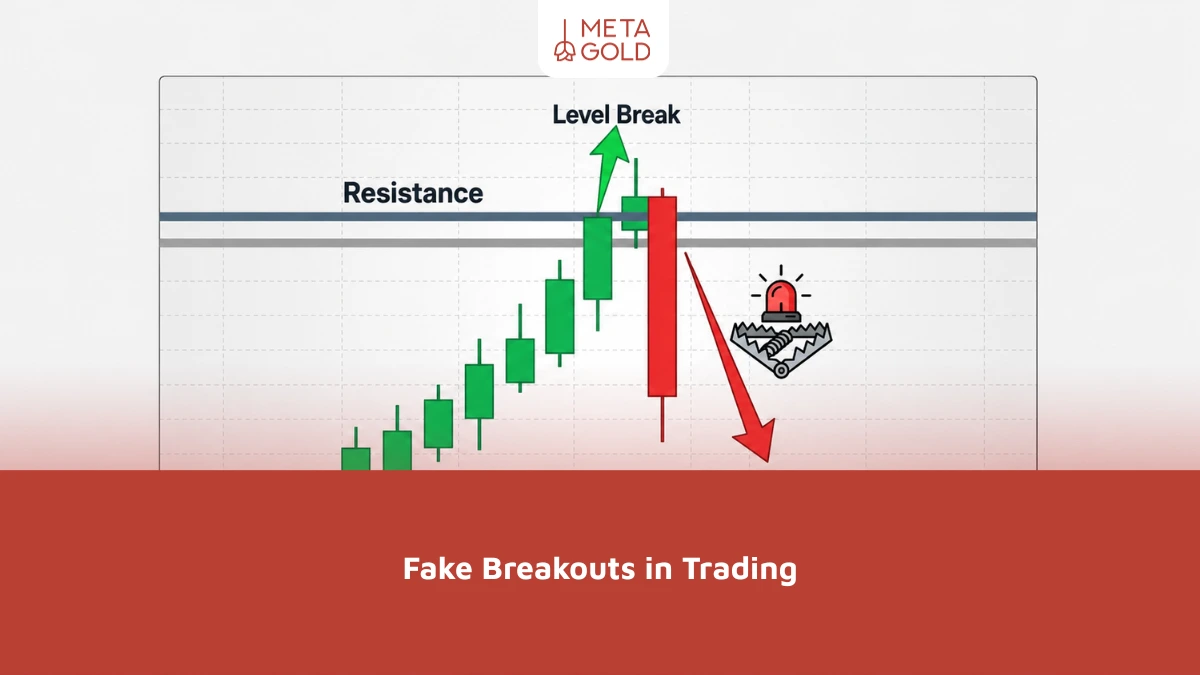
A false breakout occurs when the price breaks through a key level on the chart but fails to sustain the move and quickly returns to its previous range, causing some traders to enter the wrong trades. In such cases, traders enter a trade believing that a new trend has begun, but the market moves contrary to their expectations.
This typically occurs at key levels such as support and resistance, trend lines, or price patterns. Many novice traders enter trades as soon as a breakout occurs, even though the market may not yet have enough momentum to sustain the move.
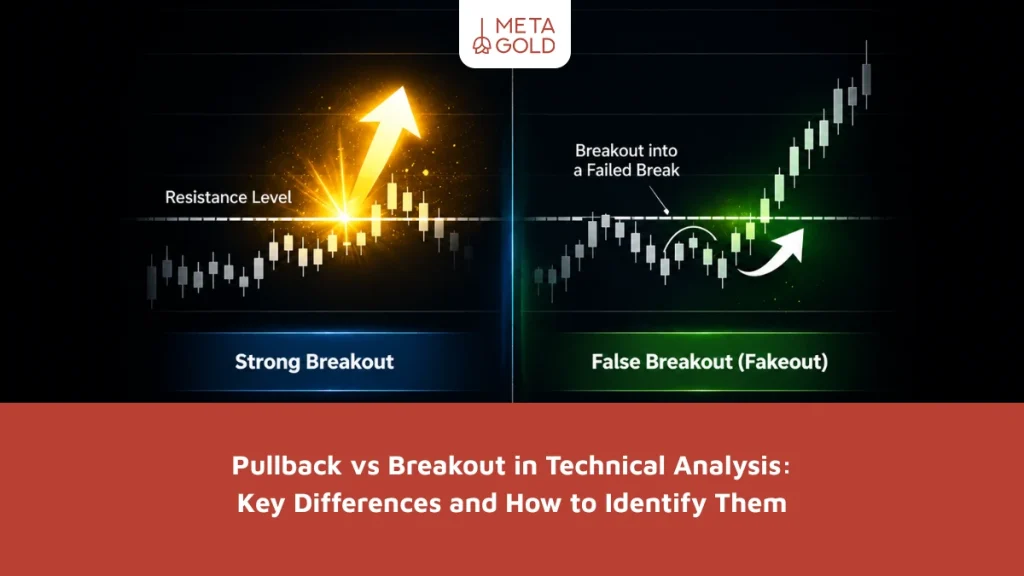
In a true breakout, the price breaks through a resistance level with strong momentum and a clear increase in trading volume. In a false breakout, however, this rise does not last, and the price returns to its previous range.
Why Do False Breakouts Occur in the Market?
Financial markets are a combination of the behavior of individual traders, large investors, and trading algorithms. For this reason, price movements are not always simple or predictable. False breakouts often occur for the following reasons:
1. Stop-Loss Hunting
Many traders place stop-loss orders above a resistance level or below a support level. Sometimes, the price breaks through that level, triggering the stop-loss orders, and then returns to its previous trend.
2. Decline in trading volume
If a key level is broken without an increase in trading volume, it is likely a false breakout. In such a case, the market does not have enough strength to sustain the new trend.
3. Actions by Large Market Participants
Large financial institutions, often referred to as “whales,” may take advantage of short-term price movements to increase liquidity before executing large trades, which can lead to misleading false breakouts.
Types of False Breakouts on a Price Chart
False breakouts can occur at various points on the chart. Recognizing these patterns will help traders spot them more quickly.
A False Breakout Above Resistance
In this scenario, the price breaks through the resistance level, and traders believe that an uptrend has begun. However, shortly thereafter, the price falls back below the resistance level and may even decline further.
A False Breakout Below Support
Sometimes the price briefly falls below the support level, and it appears that the market has entered a downtrend. However, this decline does not last, and the price returns above the support level.
False Breakouts in Price Patterns
False breakouts can also occur in patterns such as triangles, channels, and flags. In this case, the price breaks out of the pattern and then quickly returns to it.
A Fake Breakout in the Forex Market
The Forex market is one of the markets most prone to frequent false breakouts, due to its high liquidity and the large number of traders. Many currency pairs experience short-term price movements around key price levels, which can mislead traders.
In the Forex market, this occurs when economic news is released or during peak trading hours. For example, a currency pair may break through a resistance level when economic data is released, then return to its previous range a few minutes later.
For this reason, many professional Forex traders prefer not to enter a trade immediately after a specific level is broken, but instead wait for confirmation of the price movement.
How Can False Breakouts Be Detected?
One of the most important skills for traders is the ability to identify false breakouts before entering any trade. Although no method is 100% accurate, there are certain signs that may indicate a false breakout is likely.
1. Check the trading volume
In cases of genuine breakouts, trading volume increases. However, if the price breaks through an important level but trading volume does not change significantly, it is likely a false breakout.
2. Wait for the candle to close
Many false breakouts occur within a single candlestick, but by the time the candle closes, the price has returned to its previous range. Waiting for the candlestick to close helps avoid entering trades prematurely.
3. Monitor price movement after the breakout
If the price fails to make a strong move after breaking through the level, or if there is no proper retest of the broken level, the breakout may not be genuine.
4. Use a longer time frame
Sometimes a certain level is breached over short time frames, but remains stable over longer time frames. Therefore, analyzing multiple time frames provides a more accurate view of the market.
The Risks of Fake Breakouts for Traders
False breakouts are one of the most common reasons for losing trades, especially for traders with little experience in technical analysis.
The main risks are:
- Entering the Market in the Wrong Direction
- Quick Stop-Loss Trigger
- Missing Out on Real Trading Opportunities
- An increase in emotional trading and irrational decision-making, which may lead to repeated losses
In many cases, after experiencing several consecutive false breakouts, traders fall into the trap of making emotional decisions that can lead to further losses.
How to Manage the Risks of False Breakouts
Risk management is one of the most important skills in trading. Even the most experienced traders encounter false breakouts from time to time, but the difference lies in how they handle them.
| Risk Management Strategy | Description |
|---|---|
| Use a Reasonable Stop-Loss | Place the stop-loss at an appropriate distance from the breakout level so that losses remain limited in the event of a false breakout. |
| Wait for Breakout Confirmation | It is better not to enter a trade immediately after a breakout. Instead, wait for the candle to close or for the price to stabilize. |
| Combine Technical Analysis with Trading Volume | Checking trading volume at the time of the breakout can help determine whether the breakout is genuine or false. |
| Analyze Multiple Time Frames | Analyzing the chart across different time frames provides a more accurate view of the validity of the breakout. |
Summary of False Breakouts in Trading
False breakouts are among the most common phenomena in financial markets and can mislead many traders. Therefore, understanding what a false breakout is and how to distinguish it from a real breakout is a crucial factor in trading success.
Professional traders do not rush into trades. Instead of reacting immediately to every price breakout, they wait for market confirmation and monitor price action, trading volume, and market reaction at key levels. If you can incorporate this patience and precision into your trading strategy, you’ll significantly reduce the likelihood of falling victim to false breakouts.