
What are Pivot Points, and how do they work?
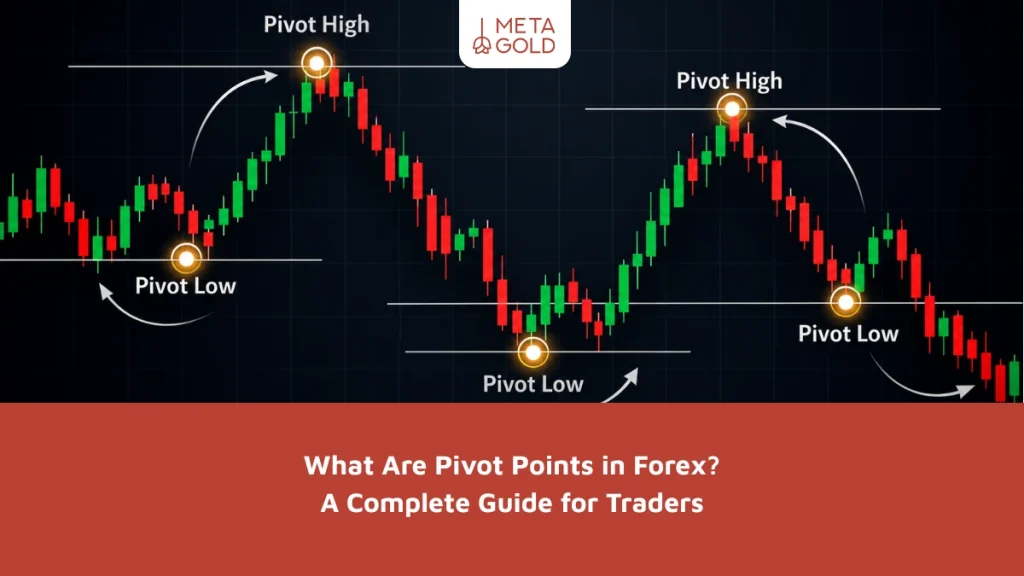
Pivot points are a set of price levels calculated based on the high, low, and closing price of the previous period. These levels typically consist of a central pivot level, along with several support and resistance levels above and below it.
Simply put, this indicator helps identify price levels where the balance between buying and selling pressure may change. For this reason, these levels are often where the market price reacts.
If you’d like to first understand the concept of a pivot in technical analysis, you can read the article:“What Is a Pivot in Trading?”
How to Calculate Pivot Points and Use Them in Technical Analysis
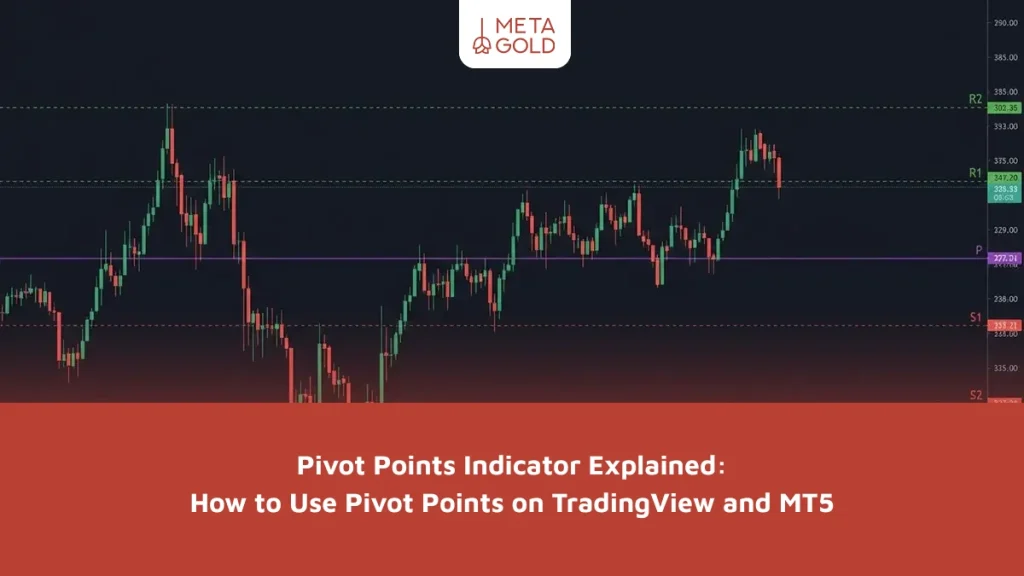
The central pivot point is calculated based on price data from the previous period. The central pivot point is considered the key level of the indicator, as it serves as the primary reference point for market analysis.
After calculating this level, several other levels are obtained:
- First Resistance Level (R1)
- Second Resistance Level (R2)
- Third Resistance Level (R3)
- First Support Level (S1)
- Second Support Level (S2)
- Third Support Level (S3)
Traders use these levels to analyze price behavior. For example:
- If the price trades above the central pivot point, this may indicate an upward trend in the market.
- If, on the other hand, the price trades below the central pivot point, this may indicate increased selling pressure.
Traders often use these levels to determine entry and exit points and profit-taking levels.
Advantages and Uses of Pivot Points in Trading
The reason the Pivot Points indicator is so popular among traders is its ability to quickly identify key market levels. Unlike some analysis methods that require a lengthy analysis of charts, this indicator automatically displays the key levels.
The table outlines the key advantages of this index:
The Pivot Points indicator is a popular tool among financial market traders due to its ease of use and accuracy in identifying key price levels. This indicator helps traders better organize their decisions and identify key levels more quickly. Below, you will find a table listing the most important practical advantages and characteristics of the Pivot Points indicator.
| Advantage of Pivot Point Indicator | Description |
|---|---|
| Quick Identification of Support and Resistance | Pivot levels help traders identify points where the price is more likely to react. |
| Suitable for Short-Term Trading | Many scalpers and day traders use this indicator to make quick trading decisions. |
| Applicable in All Markets | This indicator can be used across various markets, including Forex, crypto, and stocks. |
| Compatibility with Other Tools | The Pivot Point indicator can be combined with tools such as price action, moving averages, or the RSI indicator. |
How to Use Pivot Points in Trading
When explaining pivot points, it is important to understand that using this tool is not limited to simply viewing the lines on the chart. Traders often use these levels in a variety of trading scenarios.
1. Trading in Response to Support and Resistance Levels
One of the most common strategies is for traders to wait until the price reaches a support or resistance level and then observe the market’s reaction.
For example:
- If the price reaches the first resistance level (R1), traders may look for signs of a potential bearish reaction.
- If the price touches the first support level (S1), it could trigger a potential upward move.
2. Trading on Breakouts of Pivot Point Levels
Sometimes the price breaks through a key level with strong momentum. In such cases, traders view the breakout of that level as a signal that the trend will continue.
3. Setting Profit Targets Using Pivot Point Levels
Many traders use pivot point levels as price targets. For example, if a buy trade is executed, the next resistance level can be considered a profit target.
How to Add the Pivot Points Indicator in TradingView
One of the easiest ways to use this tool is to enable the Pivot Points indicator in the trading platform. The platform provides this indicator to users by default.
To add it, follow these steps:
- Log in to the TradingView platform.
- In the Indicators section, look for “Pivot Points.”
- Select the “Pivot Points Standard” indicator.
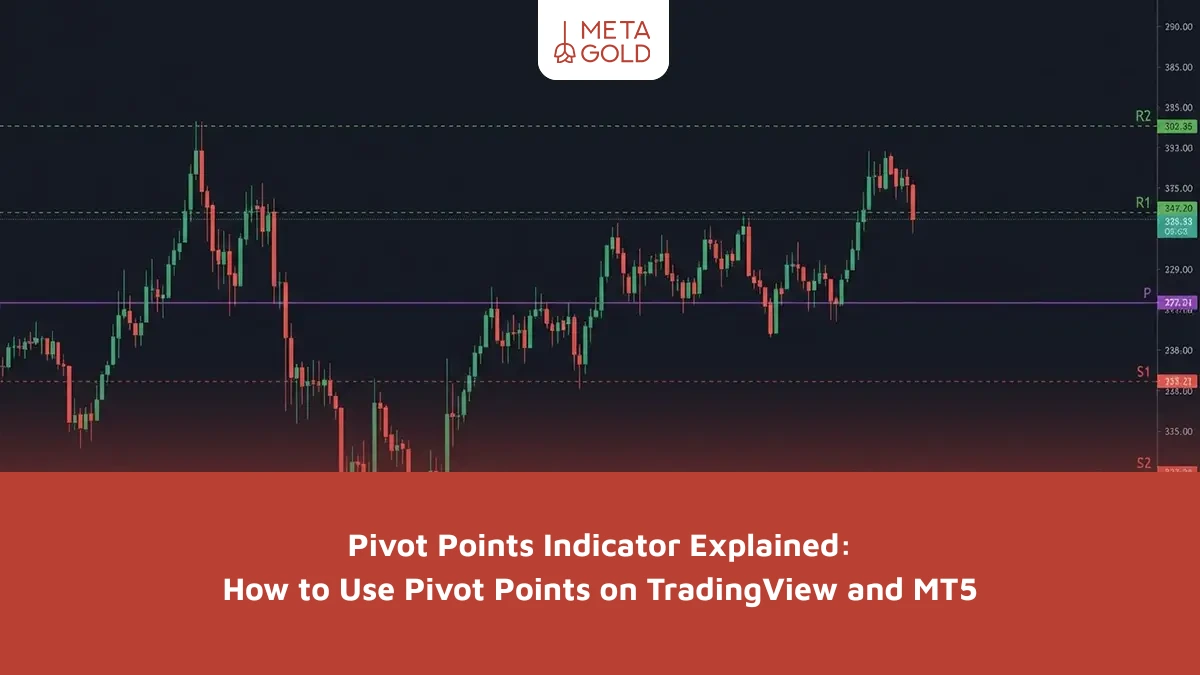
After the indicator is activated, lines representing the central pivot point and support and resistance levels appear on the chart. Users can also change the method for calculating pivot points or the time frame in the indicator settings.
How to Use the Pivot Points Indicator on the MetaTrader 5 Platform
The MetaTrader platform is one of the most widely used trading platforms in the forex market. Using the Pivot Points indicator in MetaTrader 5 is also relatively straightforward.
The Pivot Points indicator may not be installed by default in all versions of MetaTrader 5, but it can be added by installing custom indicator files.
After installing the indicator:
- The pivot point lines appear on the chart.
- Support and resistance levels are identified.
- Traders can use these levels to plan their trades.
If you’re looking for more technical analysis tools, you can use the Download Trading Indicators page on the MetaGold website.
Important Tips for Using Pivot Points in Trading
Despite the widespread use of this tool, it is very important to use it correctly. Professional traders usually focus on the following key points when using pivot points:
- The Importance of the TimeFrame in Pivot Point Analysis: Pivot point levels on different time frames can lead to different results.
- Risk Management When Trading Using Pivot Points: No single indicator provides a definitive signal, so setting a stop-loss is essential.
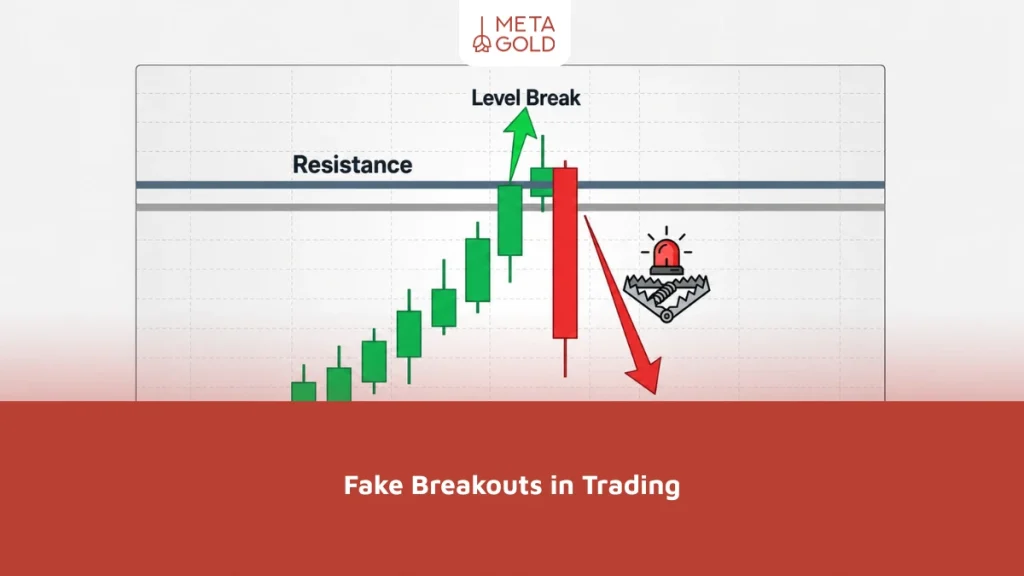
- The Impact of Market Conditions on the Effectiveness of Pivot Point Levels: In highly volatile markets, the price may cross these levels multiple times.
- Combining Pivot Points with Other Technical Analysis Tools: It is best to use pivot points in conjunction with trend analysis or price movement analysis.
Summary:
The Pivot Points indicator is a simple yet useful tool in technical analysis that helps traders identify key market levels more quickly. This indicator helps traders better understand market structure by identifying potential support and resistance levels based on historical price data.
However, the best results are achieved when pivot points are used as part of a comprehensive trading strategy—that is, in conjunction with trend analysis, price action, and risk management. Once a trader learns how to interpret price reactions to these levels, they can make more informed trading decisions within a clear risk management strategy.