
What are pivot points in Forex?
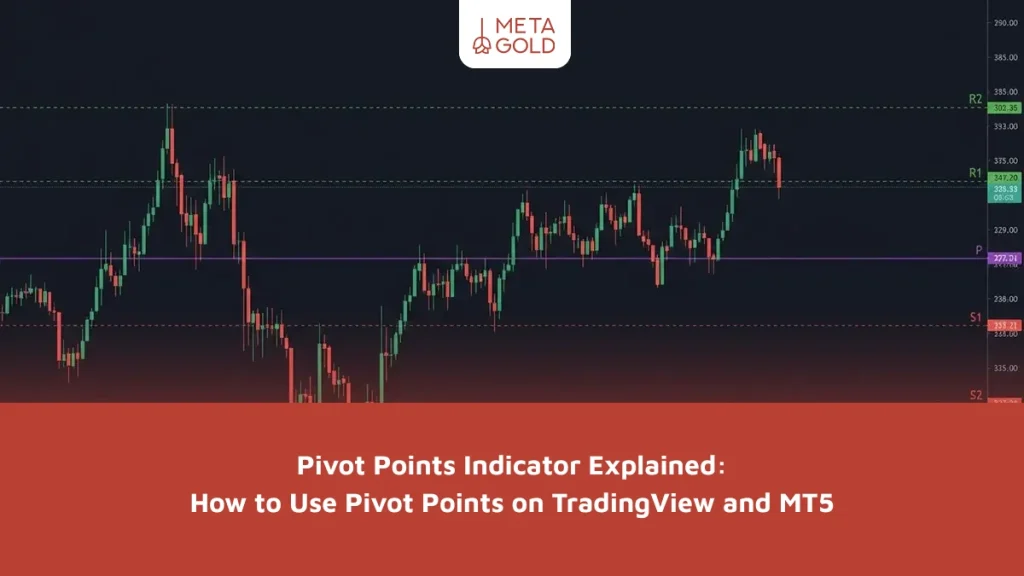
Simply put, pivot points are key price levels used in technical analysis to identify potential support and resistance areas. They are commonly calculated using previous period’s high, low, and closing prices, although traders may also use price-action-based pivot levels. These levels are often used to identify key support and resistance areas.
When the price reaches this area, several outcomes are possible:
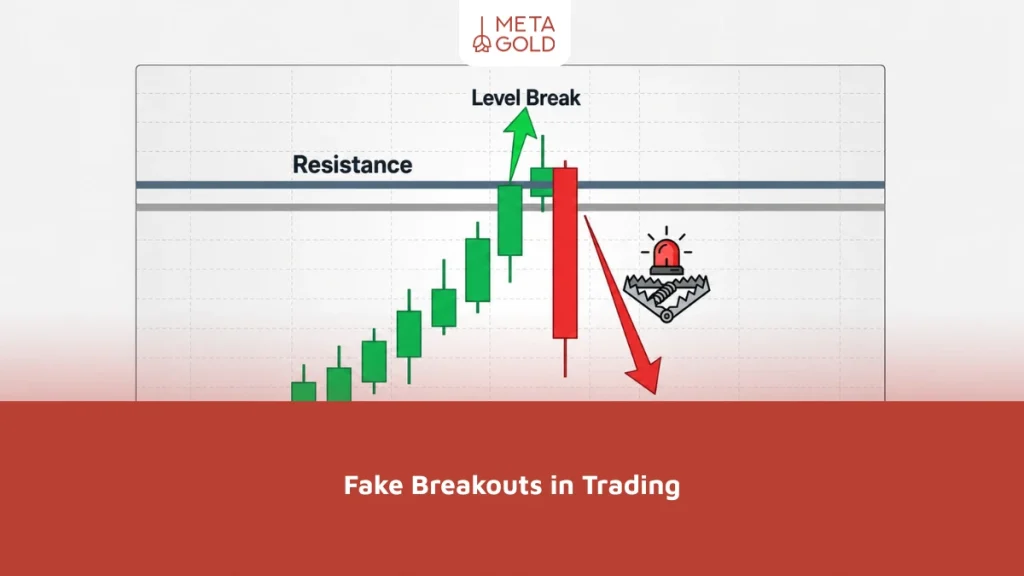
The price may either react to that level and reverse direction, or break through it, potentially signaling further movement in the same direction. For this reason, identifying pivot points helps traders understand key decision points in the market.
In fact, pivot points represent levels at which the balance between buyers and sellers shifts.
What is a pivot point, and how is it formed on a chart?
Many beginner traders may wonder what a pivot point is and how to identify it on a chart.
A pivot point is a key reference level used by traders to evaluate potential support, resistance, and market direction. This reaction may take the form of a price pause, a change in trend, or increased volatility.
In technical analysis, pivot points can be identified or calculated in different ways, including:
- The price repeatedly reacts around that level, making it a significant area for traders.
- It appears at significant price highs and lows.
- These reactions often occur when the balance between supply and demand changes.
For this reason, many traders consider these points to be key levels for market analysis.
Using Pivot Points in Technical Analysis: How Do They Help Determine Market Trends?
Pivot points in technical analysis are important tools for understanding market structure. Traders can use them to better identify market trends and analyze price behavior.
For example:
- If the market forms higher highs and higher lows, this may indicate an uptrend.
- However, if the market forms lower highs and lower lows, this may indicate a downtrend.
By studying these structures, traders can identify appropriate entry and exit points for a trade. Pivot points also help identify key support and resistance levels, which are useful in many trading strategies.
What are pivot points in Forex, and why are they important?
When discussing pivot points in Forex, it is important to note that they are widely used by traders to analyze price levels and potential market reactions. The Forex market is one of the most liquid financial markets in the world, and its prices exhibit specific reactions to technical levels.
Forex traders use pivot points for various purposes, including:
- Identifying key support and resistance levels
- Identifying potential reversal areas
- Setting price targets in short-term trading
For this reason, pivot points are very popular among day traders and scalpers.
Pivot Trading Education in Forex (How to Identify Pivot Points)
To learn about pivot points in Forex, you should first understand that pivots are generally used in market analysis through two main approaches: the price action method and the calculation-based method.
In the price action method, traders identify pivot points by observing price behavior on the chart and analyzing important highs and lows. This approach is more popular among professional traders because it provides a deeper understanding of market structure.
In the calculation-based method, pivot points are calculated using specific formulas based on the previous day’s price data. In this approach, tools such as the Pivot Point indicator are commonly used to automatically display important market levels on the chart.
Using a Pivot Point indicator can be highly beneficial for beginner traders because it helps them identify important market levels more quickly.
Types of Pivot Points in Technical Analysis: Differences and Applications
In technical analysis, pivot points are generally divided into two main categories:
- Calculated Pivot Points:These are mostly used in short-term trading and are calculated based on historical price data.
- Price Action-Based Pivot Points:Price action-based pivots are formed according to the actual structure of price movement on the chart.
Understanding different types of pivot points helps traders choose the appropriate method based on various market conditions.
Types of Pivots in Price Action
One of the most important topics in chart analysis is understanding the different types of pivots in price action. These pivots usually appear on charts as significant price highs and lows.
The most important types include:
1. Pivot High (Swing High)
A point where the price starts to decline after reaching a certain level, indicating increased selling pressure in the market.
2. Pivot Low (Swing Low)
A point where the price starts to rise after reaching a certain level, indicating buyer strength in the market.
3. Major and Minor Pivots
Major pivots are important and significant market points where large price movements occur, while minor pivots represent smaller fluctuations within the main trend.
Understanding these structures helps traders analyze market trends more accurately.
Trading Strategies Using Pivots: Applying Support and Resistance Levels
Pivot points are used in many trading strategies and can serve as a foundation for making trading decisions.
One of the most common strategies is trading near support and resistance levels. In this approach, traders look for buying opportunities when the price approaches a support pivot and look for selling opportunities when the price reaches a resistance pivot.
Another strategy is using pivot points in the direction of the market trend. In this method, traders only trade in the direction of the main market trend and use pivot points to find suitable entry points.
Additionally, many traders combine pivot points with tools such as the Pivot Point indicator to improve their analysis accuracy and identify key market levels more effectively.
Advantages and Disadvantages of Using Pivot Points in Technical Analysis: Key Considerations for Traders
Pivot points are a useful tool in technical analysis that help traders identify important price levels and potential market reaction areas. However, despite their advantages, this tool also has certain limitations and should not be used as the sole basis for trading decisions. The table below shows the most important advantages and limitations of using pivot points.
| Advantages of Using Pivot Points | Limitations of Using Pivot Points |
|---|---|
| Easy to use | Does not provide guaranteed signals |
| Applicable in all markets | May produce inaccurate results in highly volatile markets |
| Useful across different timeframes | Requires confirmation from other tools |
| Helps identify support and resistance levels | - |
| Can be combined with other analytical tools | - |
Conclusion: Pivot Points in Market Analysis
Understanding what pivot points are can completely change the way you view market structure. Pivot points are essentially a map of important market decision-making areas and help traders analyze price behavior more effectively.
If you can correctly identify pivot points and use them alongside tools such as market trends, price patterns, and the Pivot Point indicator, you can find more logical entry and exit points in your trades. Therefore, learning and practicing how to use pivot points can be an important step toward becoming a more precise and disciplined trader in financial markets.