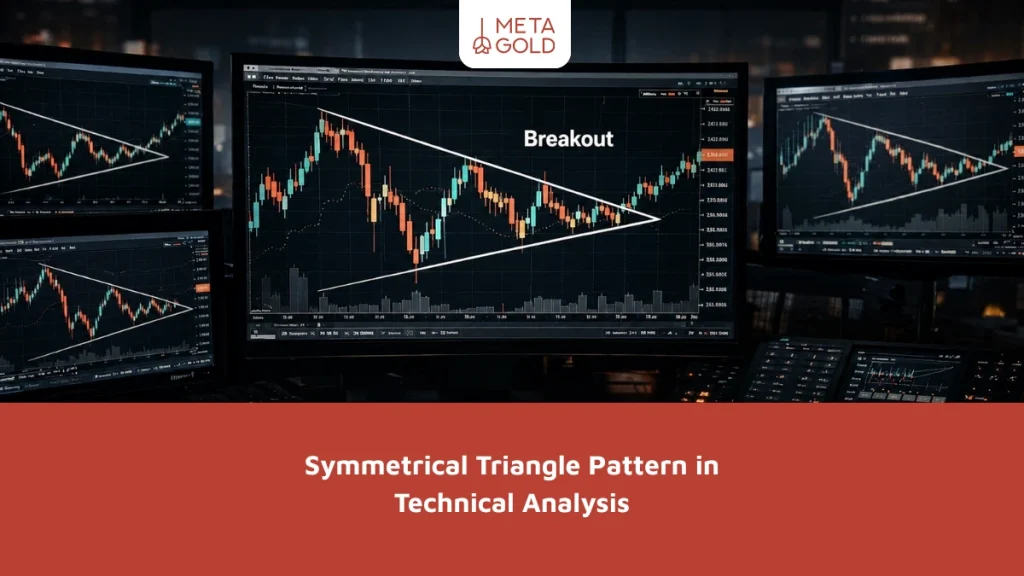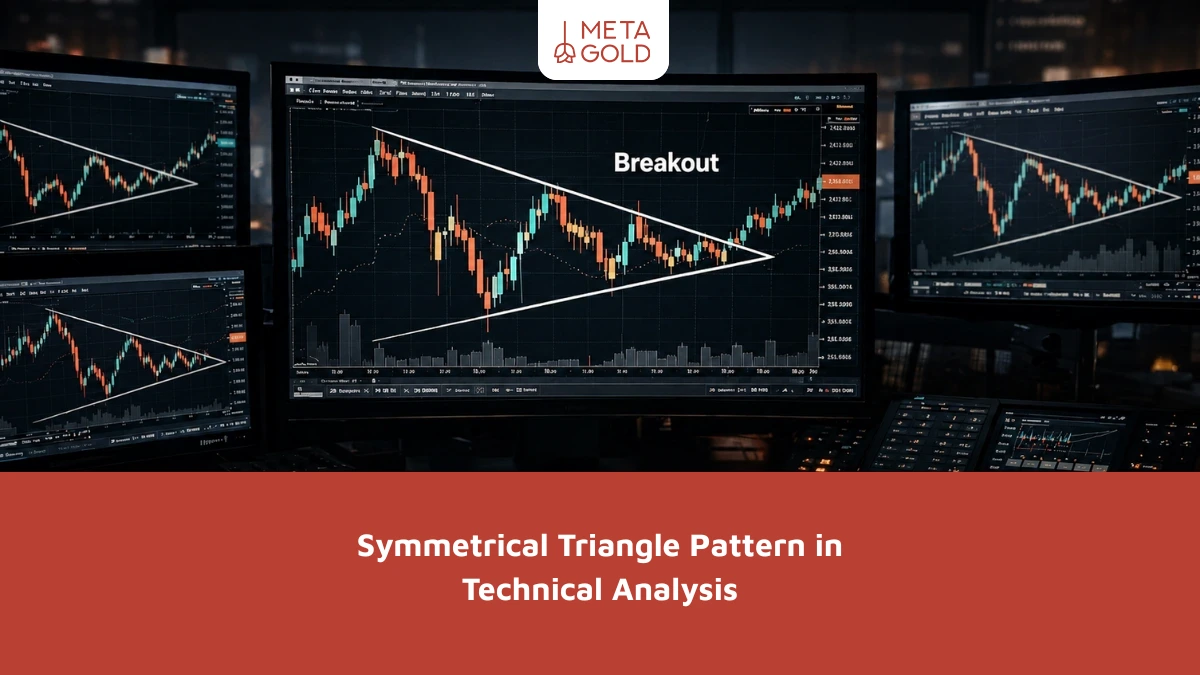

What is the symmetrical triangle pattern?
The symmetrical triangle is a commonly observed chart pattern in technical analysis. But understanding it is not always as simple as it seems. This pattern forms when the price moves between two converging trend lines; one that connects lower highs and one that forms higher lows. As we go further, the two lines get closer together and price movement becomes increasingly constrained.
Traders often interpret this phase as a period of market indecision. The price is moving, but not strongly enough to form a trend. In effect, buyers and sellers are locked in an equal struggle. This balance causes the market to consolidate rather than move.
This consolidation phase occurs for a reason. In such conditions, the market is preparing for a strong directional move. A point that many overlook is that until the breakout occurs, this pattern does not confirm any direction, and rushing to enter can lead to trouble.
If you want to understand this pattern’s place alongside other similar models more precisely, studying the triangle pattern in technical analysis can give you a more complete view.
How the Symmetrical Triangle Pattern Forms
The symmetrical triangle pattern forms after a certain trend (up or down) and during a market break, where the market enters a period of price consolidation. In this situation, the price structure gradually changes in such a way that:
- The highs are continuously recorded as lower highs.
- Lows form continuously higher (Higher Lows)
This behavior creates two converging trend lines with opposite slopes that move towards an equilibrium point. This convergence indicates a gradual decrease in the range of fluctuations and an increase in uncertainty in the market. From a market psychology perspective, this structure represents a temporary balance between supply and demand, such that any attempts by buyers to increase the price are limited by selling pressure and vice versa. As a result, market volatility is compressed within the pattern, rather than being discharged.
One of the key signs in learning the symmetrical triangle pattern is the gradual decrease in price volatility and the compression of the moves over time. As the pattern matures, the distance between the highs and lows becomes smaller and the market approaches a point where the probability of a sharp move (with a breakout) increases.
Analyzing price behavior in the symmetrical triangle pattern
In the symmetrical triangle pattern, the price behavior is more like a balance between buyers and sellers; there is no clear winner or loser. If you pay attention, every time the price approaches the lows, buyers step in and do not allow a serious drop. On the other hand, near the highs, sellers become active and stop the growth.
Lower highs and higher lows continue to form. This means that the price range is gradually contracting. This is exactly where the market enters the energy compression phase before the next move.
The closer the price gets to the top of the triangle, the more unstable this equilibrium becomes. It is at this point that one side finally takes control and the market breaks out of this situation. This break can take the form of a bullish breakout, when buyers gain the upper hand, or a bearish breakout, when sellers exert more pressure. Ultimately, it is the breakdown that determines the true direction of the market, not the pattern itself.
Types of Symmetrical Triangle Patterns
This pattern only indicates market compression and reduced volatility. However, after the price exits the triangle area, the direction of movement is determined and the breakout ultimately determines market direction.
Bullish breakout scenario of the symmetrical triangle
In an uptrend, when the price breaks above the upper trendline, it actually sends a significant signal. Here, you can sense that the buyers are no longer just defending, but have taken control of the market. If you have seen this happen on the chart, it is often accompanied by a relatively sharp move, not a weak, lifeless breakout.
In such a situation, the pattern plays the role of a continuation structure and the probability of the previous trend continuing its upward path increases. This is also known as the bullish breakout. One thing you should not ignore is the trading volume; if the breakout occurs without increasing volume, it often turns out to be a fake.
It should be noted, however, that the bullish breakout is different from the ascending triangle pattern; in the ascending triangle, a clear horizontal resistance is seen, while in the symmetrical triangle, both trend lines move in a converging manner.
Bearish breakout scenario of the symmetrical triangle
In a bearish scenario, the story is reversed. The price breaks through the lower trend line, which means that the sellers have finally taken control. This type of breakout occurs when the market is no longer willing to hold the lows and the selling pressure has clearly increased. In this case, the probability of the downtrend continuing or even a new move downward increases.
Here, as in the bullish case, volume confirmation plays a crucial role. If the breakout is not accompanied by volume, it should be treated as a potential false breakout. Ultimately, what determines the direction of the market is not the pattern itself, but the direction in which the price breaks out.
The same difference exists on the downside; the bearish breakout should not be confused with the descending triangle pattern, as the descending triangle features a stable horizontal support and lower highs.
How to Validate the Symmetrical Triangle Pattern
For a symmetrical triangle pattern to be reliable, it is not enough to simply see its appearance; several important signs must be present at the same time. The first point is the formation of two converging trend lines; one with a downward slope from the tops and the other with an upward slope from the bottoms. This structure must be clearly delineated, not drawn in a rough or imprecise way.
The next important thing is the number of times the price hits the trend lines. The more highs and lows that react to these lines, the more valid the pattern is, as it shows that the market is reacting to these ranges.
On the other hand, the behavior of trading volume plays a key role. During the formation of the pattern, the volume gradually decreases, indicating a decrease in trader participation and an increase in the waiting mood in the market. However, at the moment of a breakout, this situation should change; an increase in volume at the time of the breakout indicates that the new move has a strong backing.
The combination of these factors turns the symmetrical triangle from a simple chart formation into a more reliable trading setup.
How to trade the symmetrical triangle pattern
Trading this pattern relies more on patience and getting confirmation from the market than anything else. The main steps can be summarized as follows:
- Identifying the Pattern : First, you need to draw two converging trend lines on the chart that connect the lower highs and higher lows.
- Waiting for a Breakout : You should not enter a trade until the price has clearly broken out of one of the trend lines; entering too early increases the risk of a false breakout.
- Entering the trade : After confirming the breakout, you can enter in the direction of the price movement. Some traders wait for the price to retest the broken trendline for more certainty.
- Stop Loss : The stop loss is placed on the opposite side of the pattern and slightly outside the trend line to prevent large losses if the price reverses.
- Determining a price target : The price target is calculated by measuring the height of the maximum width of the pattern and applying it to the breakout point.
These steps are the foundation of learning the symmetrical triangle pattern for accurate trading execution and professional risk management.
Comparing the Symmetrical Triangle Pattern to Other Triangle Patterns
To accurately identify patterns in technical analysis, it is essential to understand the differences between the different types of triangles. Each of these patterns has a different structure, price behavior, and message for the trader, and misidentifying them can lead to incorrect decisions. The table below summarizes the most important differences:
| Pattern Type | Trendline Structure | Price Behavior | Breakout Probability | Overall Concept |
|---|---|---|---|---|
| Symmetrical Triangle | Two converging sloped trendlines | Gradual decrease in volatility | Uncertain until breakout | Market indecision and consolidation phase |
| Ascending Triangle | Horizontal upper line + rising lower line | Increasing buying pressure | More likely bullish | Buyers gaining strength |
| Descending Triangle | Horizontal lower line + falling upper line | Increasing selling pressure | More likely bearish | Sellers gaining strength |
| Expanding Triangle | Diverging trendlines | Increasing volatility | Irregular and high-risk | Market instability and high volatility |
Overall, the symmetrical triangle is a neutral pattern that represents a consolidation phase before a breakout, where the final direction of the move is only determined after a breakout. Conversely, if you want to see a structure that, contrary to this pattern, increases volatility, examining the expanding triangle pattern can give you a more accurate view.
Conclusion: Symmetrical Triangle Pattern
The symmetrical triangle pattern is one of the most important analytical structures that helps identify consolidation phases and potential breakout points. In this regard, paying attention to the structure of the pattern, the behavior of trading volume, and waiting for confirmation of a breakout are of great importance.
For practical application of the symmetrical triangle pattern, it is best to always wait for a valid breakout and prioritize risk management, as the direction of the move is only determined after the price exits the pattern.