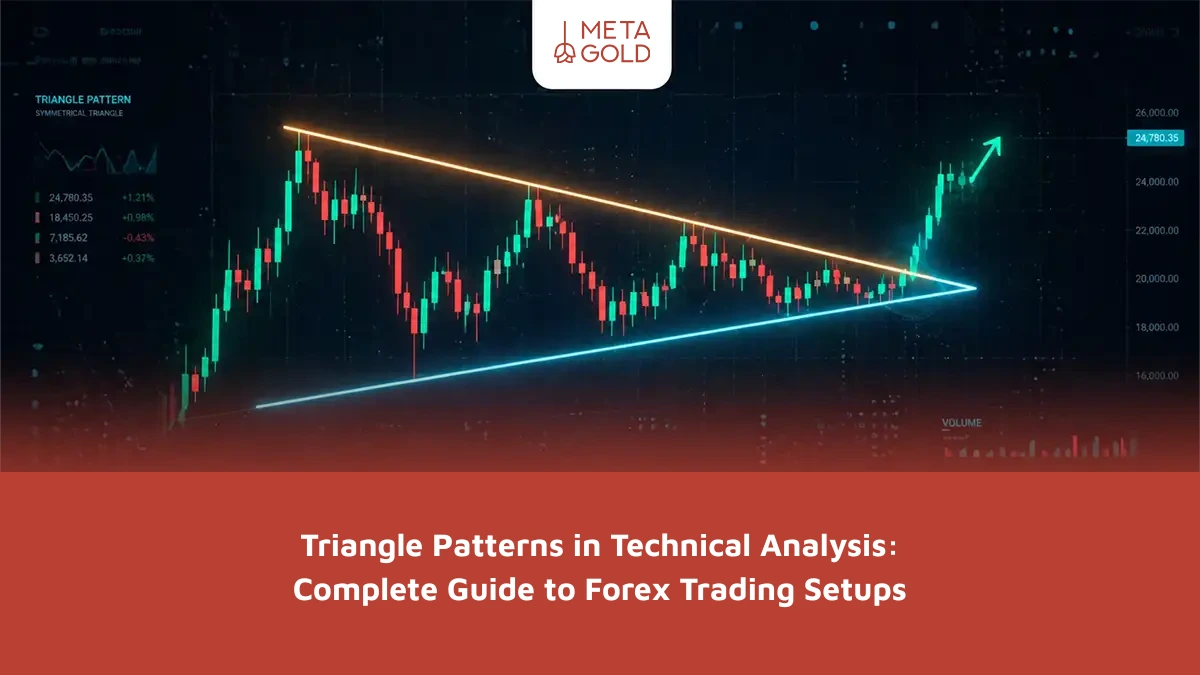

What is the triangle pattern in technical analysis?
Triangle patterns are consolidation chart patterns formed by converging trendlines that reflect decreasing volatility before a potential breakout. This pattern forms when the price, instead of trending, enters a tight range and fluctuates between two trend lines that are approaching each other.
The upper trendline connects swing highs and typically acts as dynamic resistance, while the lower trendline connects swing lows and acts as dynamic support. The more the price moves back and forth between these two lines, the smaller the range of movement becomes, indicating that the market is approaching a breakout point.
In fact, this compression reflects declining volatility and market indecision prior to a breakout. For this reason, many traders consider this pattern as a “pre-move phase,” rather than a signal itself.
The important point here is that the breakout direction cannot be confirmed until price decisively breaks and closes beyond the pattern boundaries. Therefore, the main focus is on the moment when the price breaks out of this range.
Simply put, the triangle trading pattern indicates that the market is preparing for a new move—a move that often follows a period of uncertainty.
Types of triangle patterns in Forex
In technical analysis, when talking about the types of triangle patterns in Forex, there are three main types: ascending, descending, and symmetrical triangles. Each of these is not just a shape on the chart; in fact, each one represents a specific behavior of the market.
These patterns appear when the market enters a consolidation phase; that is, it has neither a clear trend nor a strong movement. In this case, the range of fluctuations gradually becomes smaller and the price gets stuck in a tight range. It is this tightness that ultimately leads to a breakout. What many people ignore is that the pattern itself is not an entry signal; it is the preparation of the market for the next move.
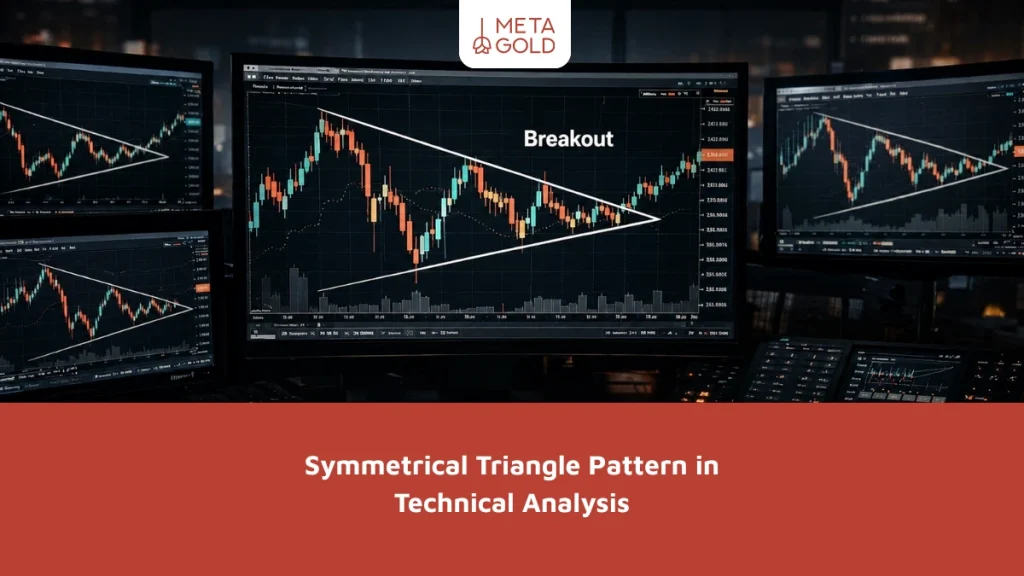
Symmetrical Triangle Pattern in Technical Analysis
The symmetrical triangle pattern is one of the most common forex triangle patterns. It forms when the price moves between two converging trend lines; the upper line is sloping down and the lower line is rising up.
If you’ve seen this pattern on a chart a few times, you’ll realize that the market is essentially in a state of indecision. Neither buyers have enough strength to break through resistance, nor sellers can keep the price down. The result? A back-and-forth movement that becomes more and more limited each time.
This compression increases as the price approaches the top of the triangle. This is where the market is “gathering energy.” But the important thing is that the direction of the breakout is not known in advance. The price may break up or, conversely, break down. However, in many cases, the breakout occurs in the direction of the previous trend. For this reason, traders study the trend before the formation of the pattern before making any decisions.
When trading the symmetrical triangle pattern, the most important thing is to wait. Not for the formation of the pattern, but for confirmation of the breakout. When the price closes a few candles outside the trend line and the trading volume increases at the same time, you can enter with more confidence. Otherwise, there is a possibility of a false breakout.
Expanding Triangle Pattern in Forex
The expanding triangle pattern can be considered one of the most unusual among the forex triangle patterns. Contrary to what we expect from triangle patterns, namely the compression of the price, here we are faced with exactly the opposite behavior. In this structure, instead of the fluctuation range decreasing, the price rises and falls more sharply each time. In simpler terms, the ceilings are getting higher and the floors are getting lower. This means that the market is not only not calming down, but is also becoming more unstable.
From a trader’s perspective, this situation is more like a hesitant and indecisive market. Neither the buyers nor the sellers are in complete control. This makes it harder to predict the next move. The important thing here is how to deal with such a situation. Unlike other types of triangle patterns in Forex that form before a clear move, this pattern is more likely to have sudden and even deceptive moves.
Therefore, you should be more careful when trading the expanding triangle pattern:
- Pay attention to the increase in volume at the moment of breakout.
- Checking the price reaction after exiting the range
- Avoid early arrivals.
Ultimately, this pattern is best suited to traders who have sufficient experience in risk management, as the extreme fluctuations in this structure can both create opportunities and, if done incorrectly, quickly lead to losses.
Ascending Triangle Pattern in Technical Analysis
Among the types of triangle patterns in Forex, the ascending triangle pattern is one of the most obvious and understandable. It is often seen in the continuation of an uptrend and shows signs of buyer dominance from the very beginning.
The structure is simple, but the behavior behind it is more important. We have a fairly constant resistance level that the price hits and bounces off several times. In contrast, the price bottoms are formed higher each time. This means that buyers are willing to enter the market at higher prices, gradually neutralizing the selling pressure.
If you follow this pattern on the chart, you will notice an interesting thing: every time the price approaches resistance, the reaction of sellers is weaker than before. This is exactly where the market is preparing for a breakout. When this resistance is broken, a fast and powerful move is formed. This breakout is often accompanied by an increase in trading volume, which makes the signal more credible.
When trading the ascending triangle pattern, many people wait for the moment of breakout and then enter a long position. Some also use the distance of the maximum width of the triangle to estimate a price target.
However, it should not be forgotten that this pattern is not always a continuation. In some specific situations, it may also play a reversal role. For this reason, checking the overall market conditions and getting confirmation before entering is still the most important part of the job.
Descending Triangle Pattern in Forex
Among the forex triangle patterns, the descending triangle pattern forms when the market is under selling pressure and signs of buyer weakness are gradually becoming more apparent. This pattern is often seen in the continuation of a downtrend, but what makes it significant is the price behavior within its structure.
Here we have a relatively stable support level that the price hits and bounces back several times. But the main point is elsewhere: each time the price bounces back, a new high is created lower than the previous one. This means that sellers are gradually gaining ground, and buyers no longer have the same power as before.
If this trend continues, there will come a point where this support no longer works. From there, the price will break down and the downtrend will accelerate. This break is more reliable when it is accompanied by increased trading volume, as it indicates that the selling pressure is real, not just a short-term move.
To trade the descending triangle pattern, most traders wait for this moment; that is, they enter a short position after the support is broken. Of course, rushing into this is a common mistake. Many times the market will make a false break and quickly recover.
For this reason, it is important to wait for confirmation of a breakout, such as a few candlesticks closing below support. Finally, although this pattern is more commonly known as a continuation pattern, one should always consider the overall market conditions to make a more informed decision.
How to Trade the Triangle Pattern in Forex; Entry Strategy, Breakout Confirmation and Risk Management
To be successful in trading the triangle pattern, the most important principle is to not just rely on the appearance of the pattern and to wait for the confirmation of the breakout. Triangle patterns inherently indicate price compression, and this compression leads to a powerful move, but the direction of this move is only determined after the breakout. Among them, early entry is one of the most common mistakes traders make. For this reason, a professional approach includes several key steps:
- Waiting for the price to cross the trend line (up or down)
- Examining the increase in trading volume at the same time as breakout
- Wait for the price to close outside the triangle.
- Checking for continuation of movement in subsequent candles to prevent false breakouts
One important point is that a valid breakout is accompanied by increased volume, which indicates new liquidity entering the market. Also, professional traders often use a delay approach, meaning they wait a candle or two even after a breakout to make sure the move is real.
However, it should be borne in mind that the market does not always behave in a predictable way. Even the best triangle pattern in Forex may be accompanied by a false breakout. Therefore:
- It is necessary to use a stop loss.
- Combining the template with other tools is important.
- Money management plays a decisive role in the outcome of trades.
Ultimately, success in this strategy depends not only on pattern recognition, but also on patience, confirmation, and risk control.
Comparing the Triangle Pattern to Other Trading Patterns
A full understanding of forex triangle patterns is achieved when they are examined alongside other technical analysis structures. The triangle pattern is a powerful tool on its own, but it is most effective when used within the context of a broader set of trading patterns . Structurally, triangle patterns are similar to many classic patterns, especially those based on trend line convergence. These similarities help the analyst interpret market behavior more accurately.
Some of the most important related patterns are:
- Wedge pattern : has converging trend lines but with a distinct slope
- Pennant pattern : formed after a rapid price movement
- Continuation patterns : which, like triangles, indicate a temporary pause in the trend.
Summary of the triangle pattern in technical analysis
A proper understanding of the triangle pattern in Forex allows the trader to recognize the phases of market compression and prepare for the next move. As you have seen, understanding the types of Forex triangle patterns and focusing on confirmation of breakout is the most important factor in reducing trading errors. For practical use, first identify the pattern, then wait for confirmation of breakout, and finally enter the trade with respect to money management. This approach will make your decision-making go from guesswork to an analytical process.