When the market enters a volatile phase, entering a trade is more sensitive than ever; because a single candle can change the short-term direction of the movement and disrupt your scenario. For this reason, many traders turn to next candle prediction indicators ; tools that, by analyzing recent price behavior and candle data, estimate the probability of the next candle being bullish or bearish, in order to make more accurate decision-making and risk management. In
In this article, we will first explain how these indicators work, identify which markets and conditions they perform best in, and where they may fail. Then, we will introduce and compare the best examples that can be used in TradingView, MetaTrader 4, and MetaTrader 5.
What is the next candle prediction indicator?
The next candle detection indicator is a script or analytical tool in platforms such as TradingView and MetaTrader that uses mathematical and statistical algorithms to predict the direction of the next candle (up or down) in a probabilistic manner. The output of these indicators is not definitive; therefore, it should be used in conjunction with price action, support and resistance areas, and other tools to make decisions.
Types of indicators for predicting the next candle in TradingView
In TradingView, there are various scripts for the Next Candle Prediction indicator in the Community Scripts section. These scripts are created by users and programmers and their performance is not guaranteed, so be sure to familiarize yourself with the backtesting method in TradingView before using it on a live account.
Next Candle Predictor Indicators
This category includes the most common and simplest types of next candlestick prediction tools, designed to be quick to use and easy to understand.
- How it works: These indicators predict recent candlesticks by analyzing historical data such as opening and closing prices, trading volume, and momentum.
- Visual display: A hollow or colored candle is displayed right next to the last real price candle.
- Main use: These tools are mostly of interest to scalpers and short-term traders (such as 1 or 5 minutes).
Candle Direction Forecast Indicator
These indicators are simpler and, instead of drawing a full candle, only estimate the direction of the next candle (bullish/bearish).
- How it works: These tools only estimate the next price direction (up/down) and calculate the next candle direction using statistical or momentum approaches.
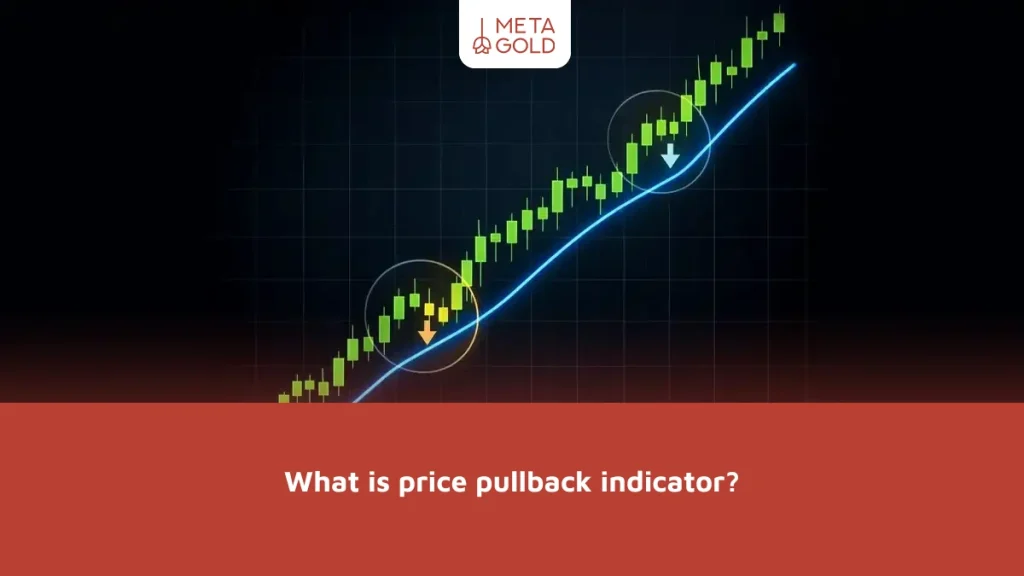
- Visual display: Their output is displayed as colored arrows above or below the candles, or as a histogram in a separate panel.
How to use the Direction Prediction indicator in TradingView
- Identify a key area: First, identify a key support or resistance level or supply and demand area.
- Waiting for signal: Wait for the price to reach this area.
- Get confirmation: If the indicator displays a bullish arrow in the support area, it can be considered as an entry confirmation.
AI/ML-Based Indicators and Statistical Models
As AI becomes more popular, many developers are using this term to introduce and market their scripts.
- How it works: Some candlestick prediction indicators use machine learning (ML) models to analyze more complex patterns.
- Reality: These scripts rely on combining classic indicators with statistical models.
- How to use: The best approach is to use them as a second opinion alongside the main analysis.
Indicators based on candlestick patterns and historical statistics (Pattern Statistics)
This category usually offers a more transparent approach because it relies on historical data and probabilistic calculations.
- How it works: Classic candlestick patterns are identified. Then, based on price records, historical success rate, sample size, average return, and evaluation time frame are reported.
- Visual display: The name of the pattern is displayed on the chart. Next to it, key indicators such as the probability of the next move and, if supported, the moving average are shown.
- Main advantage: This approach provides a statistical advantage and makes decision-making more based on historical numbers and evidence. The results depend on the quality of the data, the definition of the pattern, the time frame in Forex and the market conditions.
Types of indicators for predicting the next candle in MetaTrader
On the MetaTrader platform, the Next Candle Prediction indicator is more probabilistic in nature and should be used with caution and as a confirmer with other tools. Two well-known options are:
Candle Predictor indicator
The Candle Predictor indicator is designed to estimate the likely direction and range of the next candle’s closing and displays the signal as an alert on the chart. Its advantage is its clear application and simple settings. Usually, the signal is issued on the current candle, and you can set the entry/exit schedule for the next candle (with confirmation from other tools).
NextCandlePredictor indicator
This is a version of the indicator that its creator claims works “without repainting” and displays the likely direction of the next candle on different timeframes, which is why it is usually recommended for volatile trading sessions. However, it is better to confirm the signals with price action and volume.
Advantages and disadvantages of the next candle detection indicator
These indicators, based on historical data and momentum, provide a possible view of the direction or range of the next candle. However, the output is not definitive. Below are the advantages and disadvantages of this indicator:
| Advantages | Disadvantages |
|---|---|
| A probabilistic view of the next candle | Inherent uncertainty |
| Improved entry timing | Sensitive to market conditions |
| Ability to set entry filters | Results vary across different symbols and timeframes |
Strategies based on the indicator predicting the next candle
To use these indicators responsibly, there are common approaches that measure their potential signal within a broader context. The goal is that a raw prediction is only valid if it converges with other evidence and becomes a well-informed trading decision.
Combining the Next Candle Prediction Indicator with RSI
Combining the next candlestick prediction indicator with the relative strength index (RSI) is a smart way to filter signals and increase the probability of successful trades.
Sales scenario
- Suppose the RSI has entered the overbought zone (above the 70 level). This situation is not a sell signal per se, but rather a warning that buyer power is diminishing.
- At this point, if the candlestick prediction indicator issues a bearish signal, this is a confirmation along with other checks to enter a sell trade.
Purchasing scenario
- Similarly, when the RSI is in the oversold zone (below level 30) and the next candle prediction indicator gives a bullish signal, this combination creates a fundamental condition for entering a buy trade.
Combining the Next Candle Detection Indicator with MACD
Combining this tool with MACD helps you trade in the direction of market momentum. The MACD indicator shows the direction and strength of the trend by crossing the signal line and histogram, providing a clear picture of buying and selling pressure.
Purchasing scenario
- Wait for a MACD bullish cross (the MACD line crosses above the signal line). This event signals increased buying pressure and strengthening bullish momentum.
- Then use the bullish signal of the next candle prediction indicator as an entry confirmation.
Sales scenario
- After the MACD bearish cross forms (the MACD line crosses below the signal line),
- Look for a bearish signal from the candlestick indicator so that your short-term entry aligns with the prevailing trend and momentum.
Combining the Next Candle Detection Indicator with Price Action
First, identify a valid setup using price action, such as a support or resistance level or a reversal candlestick pattern (such as a pin bar). This is your main signal. If the indicator identifies the next candlestick in the same direction, it can serve as additional confirmation for entry.
Summary of the indicator predicting the next candle
The Next Candle Prediction indicator is an interesting but high-risk tool. These indicators are purely probabilistic tools; their value is revealed when used alongside price action, support and resistance, and candlestick patterns. Successful trading requires a comprehensive strategy, a deep understanding of the market, and proper risk management. You can then open a MetaGold demo account and test your trading strategies in this area.