What Is the Ichimoku Indicator? A Comprehensive Explanation of Its Components and Signals
Goichi Hosoda began developing the Ichimoku system in the 1930s, and it was publicly introduced in the late 1960s. It is designed to identify trends and support and resistance levels, as well as to help traders analyze potential price movements in financial markets, and it later gained widespread global popularity.
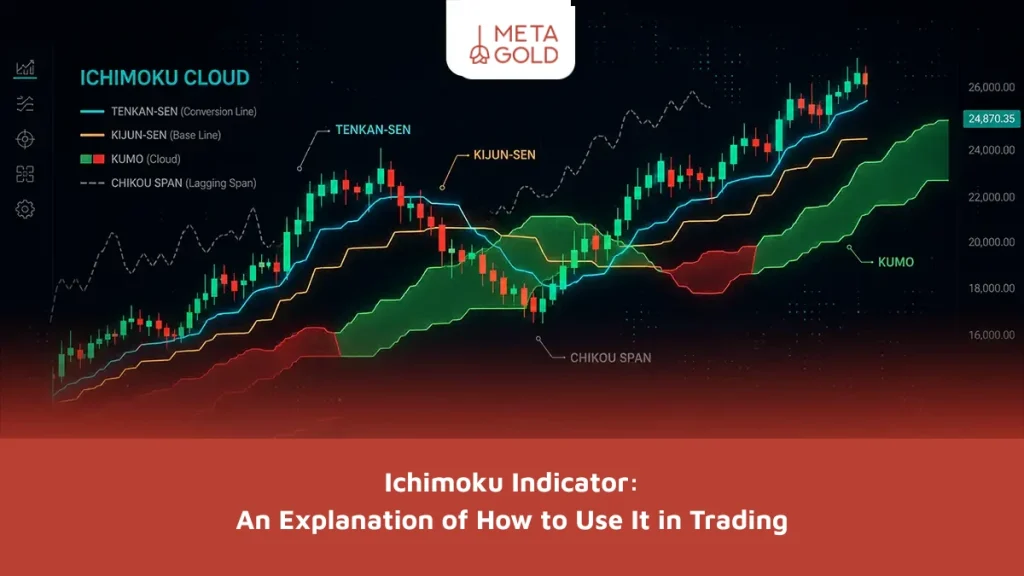
When the price is above the Kumo cloud, this usually indicates an uptrend, while a price below the cloud indicates a downtrend.
The secret to the Ichimoku indicator’s popularity lies in the fact that it does not provide just a single signal, but rather consists of several components that offer a comprehensive view of market trend, momentum, and structure. For this reason, many traders consider it a comprehensive analytical system.
What are the components of the Ichimoku indicator?
To better understand the Ichimoku indicator, it is important to first familiarize yourself with its main components. The indicator consists of several lines and a cloud, and each component provides different information about market movement. Some components of the Ichimoku indicator are used to determine the overall trend, while others measure the strength of price movement, and still others help identify areas of support and resistance.
| Ichimoku Component | Main Role | Application in Analysis |
|---|---|---|
| Tenkan-sen | Measuring short-term momentum | Identifying the speed of trend changes |
| Kijun-sen | Market equilibrium line | Support/resistance and trend confirmation |
| Chikou Span | Confirming the past relative to the present | Filtering weak signals |
| Senkou A/B | Creating the Kumo Cloud | Forecasting future support and resistance levels |
| Kumo (Cloud) | Displaying trend structure | Identifying trend direction, strength, and breakout zones |
What is the formula for calculating the Ichimoku indicator?
For many traders, learning the Ichimoku indicator isn’t just about recognizing the lines and signals; understanding the formula and the logic behind its calculation will help you study this tool more deeply and accurately. When you understand the fundamentals behind each component of the Ichimoku, you’ll better understand why certain signals are so powerful and why this indicator can provide a more comprehensive view of the market.
Unlike many simple tools, this indicator is not limited to being a simple average or a line. Rather, its structure is based on the balance of prices over different time periods, and as a result, it can show the current state of the market and provide a better insight into the likely price trajectory.
Formula for the Main Components of Ichimoku
The following are the basic formulas for the Ichimoku equation:
- Tenkan-sen: (Highest Price + Lowest Price) ÷ 2 over the last nine periods
- Kijun-sen: (Highest price + Lowest price) ÷ 2 over the last 26 periods
- Senko Span A: Senkou Span A: (Tenkan-sen + Kijun-sen) ÷ 2, plotted 26 periods ahead.
- Senko Span B: (Highest price + Lowest price) ÷ 2 over the last 52 periods.
- Chikou Span: The current closing price plotted 26 periods backward.
The Logic Behind the Numbers 9, 26, and 52 in Ichimoku
One of the most important characteristics of the Ichimoku indicator is its reliance on the numbers 9, 26, and 52 in calculating its main components. These numbers form the key ranges for Ichimoku calculations, and each is used to measure a specific aspect of price behavior:
- The number 9 is used to analyze short-term market movements.
- The number 26 offers a more balanced view of price trends and equilibrium.
- The number 52 is used to assess the broader market structure and the most significant levels.
Combining these three time frames allows for an analysis of the Ichimoku indicator that goes beyond mere short-term fluctuations and provides a multidimensional view of the market.
Key Signals of the Ichimoku Indicator
When analyzing the Ichimoku indicator, it is not enough to simply look at the lines and the cloud; it is important to understand the significance of each component and how to interpret it within the context of the market. Ichimoku shows the market situation from multiple angles, which is why traders use it to analyze trends, the strength of price movements, and key trading zones.
Tinkansen and Kijun-sen Train Intersection Signal
One of the most common signals in the Ichimoku indicator is the crossover of the Tenkan-sen line with the Kijun-sen line. When the Tenkan-sen crosses the Kijun-sen from below, it is considered a sign of strengthening upward momentum. Conversely, if the Tenkan-sen line breaks through the Kijun-sen line from top to bottom, this may serve as a warning of increasing selling pressure. Naturally, this signal is most valuable when it aligns with the price’s position relative to the Kumo cloud.
Kumo Cloud Penetration Alert
A breakout from the Kumo cloud is one of the most important signals indicating a change in market direction. When the price moves from below the cloud to above it, the likelihood of an uptrend increases. Conversely, a breakout from the top of the cloud to the bottom is considered an indicator of market weakness and the likelihood that the downtrend will continue.
Chikou Span’s Signal to Confirm the Trend
The Chikou Span line plays an important confirmatory role, helping traders assess the strength or weakness of a trend more accurately. If the Chikou Span line is above previous prices, this indicates a strong uptrend. If it is below the price chart, however, this indicates a weak trend or that sellers are in control. Therefore, this component is crucial in analyzing the Ichimoku indicator to filter out weak signals.
Dynamic Support and Resistance with Komo
One of the most important uses of the Ichimoku indicator is to identify dynamic support and resistance levels. The Kumo cloud not only helps identify trends but can also act as dynamic support and resistance zones. In uptrends, the Kumo cloud acts as a dynamic support zone, while in downtrends it becomes a resistance zone. This feature makes the Ichimoku indicator an effective tool for managing entry and exit points.
To learn more about this tool, you can read the article on the Ichimoku strategy.
The Best Ichimoku Indicator Settings (Forex, Cryptocurrencies, and Stocks)
One of the most common questions about the Ichimoku indicator is: Are the default settings suitable for all markets, or does the choice of settings depend on the type of market and trading style?
the time frame and trading style. However, most traders start out using the default settings and only change them when necessary.
Who are the default settings 9, 26, and 52 suitable for?
The 9, 26, and 52 settings are considered the classic settings for the Ichimoku indicator, and they are the most commonly used among traders.
These settings are best suited for traders who want to understand the structural basis of the indicator and obtain a balanced analysis. In the forex and stock markets, these figures remain a common basis for analyzing trends and signals.
Changing the settings is useful when done with a clear rationale and based on your trading style. However, if you change the numbers without verifying them just to get more signals, the accuracy of the analysis may decrease.
Scalp
Some scalpers use adjusted settings such as 6, 13, and 26.
The recommended settings are 6, 13, and 26, which are suitable for short time frames such as one minute, three minutes, and five minutes. They offer fast response times but may generate more false signals.
Day Trading
Recommended settings: 9, 26, 52
Suitable for time intervals of 15 minutes, 30 minutes, and one hour; it offers a good balance between response speed and signal reliability.
Swing Trading
Recommended settings: 12, 30, 60 or 9, 26, 52
Suitable for 4-hour and daily use; reduces short-range noise and is used to capture larger movements.
What is the best time frame for using the Ichimoku indicator?
The choice of time frame for the Ichimoku indicator depends on the trading style. This tool can be used on most time frames, but the quality of the signals varies depending on the time frame.
Ichimoku on Short-Term Time Frames
On short time frames, the Ichimoku indicator reacts more quickly to price movements, which is useful for scalping or short-term trading. However, the likelihood of false signals increases in these time frames, so it should be used with greater caution.
The Ichimoku Indicator for the Medium and Long Term
In the medium- and long-term time frames, the Ichimoku indicator provides a clearer picture of the trend and key market levels. For this reason, many traders use these time frames to conduct less risky analyses.
In general, the longer the time frame, the more reliable the Ichimoku signals become and the fewer false signals there are. If your goal is to achieve greater accuracy, longer time frames are the best choice; however, if your trading style is short-term, you should evaluate the signals using more precise criteria.
The Main Uses of the Ichimoku Indicator in Technical Analysis
The Ichimoku indicator is not limited to providing a simple signal; it is used in various aspects of technical analysis. This tool helps traders form a more comprehensive picture of the market and make more accurate decisions.
- Identifying the Trend: The Ichimoku indicator is very useful for determining whether the trend is uptrend, downtrend, or neutral.
- Finding Entry and Exit Points: With the help of signals and the price’s position relative to the Komo, you can find more favorable entry and exit points.
- Setting Stop-Loss and Take-Profit Levels: Some components of the Ichimoku indicator can be useful for identifying reasonable stop-loss and take-profit levels.
- Filtering Out Weak Signals: Checking multiple Ichimoku sections at once makes it easier to filter out low-quality signals.
- Combining Price Action and Trading Volume: The Ichimoku indicator is most useful when used in conjunction with tools such as price action and trading volume.
Ishimoku Indicator Summary
The Ichimoku indicator is a comprehensive technical analysis tool that helps traders understand trends, price momentum, and support and resistance levels within a single integrated system. If you’re a beginner, the Ichimoku indicator can help you take a more systematic approach to the market. If you’re a more experienced trader, this tool can complement your analysis alongside other methods.
At the same time, the Ichimoku indicator yields the best results when its components are analyzed as a whole, rather than relying on a single signal. You can also take advantage of the trading indicators download page to access more market analysis tools.