Mistaking a trendless market for the start of a new trend is a trap that leads to early entries and consecutive losses. By accurately identifying neutral ranges, the Range Market Detection Indicator helps you avoid risky trades and reserve your capital only for golden opportunities and major market waves.
In this article, we will first learn how these indicators detect the range phase, then introduce the best trading view tools along with practical strategies. Finally, by comparing these tools for each timeframe, we will help you choose the best option to improve your trading results.
What is the indicator for detecting a ranging market?
The range detection indicator is a tool that helps you identify a market range phase by examining price behavior, volatility, and trend strength. These indicators usually identify price swings or warn of potential false breakouts. In this view, their goal is not to make definitive predictions; rather, they are to filter out inappropriate entry times and help manage risk in Forex by choosing the right strategy.
Ranging Market Conditions and Their Characteristics
A ranging market is a situation where the price, instead of moving continuously in one direction, moves up and down between two distinct boundaries, spending most of its time in a “range.” In this situation, highs and lows are usually repeated close together, and there is not enough energy to sustain a strong trend. Recognizing the signs of a ranging market is important for times when the probability of an entry error is high.
The difference between a range and a trending market at a glance
The following table outlines the differences between both types of markets:
| Range-Bound Market | Trending Market |
|---|---|
| Swing highs and lows at similar levels | Higher highs & higher lows (uptrend) or lower highs & lower lows (downtrend) |
| False breakouts | Valid breakouts |
| Low ATR | Rising ATR |
| Tight/contracting range | Expanding range |
Introducing the best indicators for detecting the range market in TradingView
There is no single tool in TradingView that can definitively identify a ranging market, but a combination of several trend-detecting range indicators can filter out non-trending conditions with reasonable accuracy. Below, we introduce the most practical options.
ADX indicator
The Average Directional Index (ADX) indicator simply measures the strength of a trend. When the ADX value is low (usually below 20 or 25), the market does not have enough energy to form a trend and is likely to be ranging. For this reason, this indicator is one of the most common tools for detecting a ranging trend.
Bollinger Bands indicator
In a ranging market, the Bollinger Bands often come closer together, creating a Band Squeeze. This compression indicates a decrease in volatility and price movement within a range. It should be noted, however, that band compression can be a precursor to a breakout and does not necessarily indicate a continuation of the range.
ATR indicator
The Average True Range (ATR) indicator measures the amount of market volatility. A gradual decrease in it usually means that volatility is decreasing and the market is likely to enter a range phase. ATR is not a trend detection indicator on its own, but when combined with other tools, it gives a more accurate picture of market conditions.
Donchian Channel indicator
The Donchian Channel indicator shows the highest and lowest prices within a given range. When the price fluctuates between the top and bottom of the channel for a long time and the channel does not have a clear slope, it can be considered a sign of a market range. This tool helps to visually understand the range.
Choppiness Index indicator
The Volatility Index indicator is designed to detect markets with noise and range. When the number is higher, it means that the market is more volatile and does not have a strong trend. With the help of this tool, it filters out times when a trend entry is more likely to be wrong.
Indicator-based strategies for detecting market range
When this indicator shows a non-trending market, your main goal should be to filter out trending entries and adopt a range-compatible approach. The following strategies will help you identify range signals and reduce the chance of making a mistake on false breakouts:
Range Filter Strategy with ADX + Bollinger Squeeze
This method, by combining trend strength (ADX) and volatility (Bollinger Bands), helps to identify the range market as accurately as possible to avoid low-quality trend entries.
- If the ADX is low (for example, below 20 or 25), it means that the trend strength is low and the probability of the market being in a range increases.
- If the Bollinger Bands are close together (Band Squeeze), it means that volatility has decreased and the price is likely to move back and forth within a range.
- When both conditions are seen at the same time, instead of following breakouts and trend entry, focus on the top and bottom of the range and only look for price reaction near the boundaries.
Range Detection Strategy with Choppiness + High/Low Range
When the volatility index indicator is high, it means the market is noisy and volatile.
- If the indicator is high, consider the market to be “no trend”.
- Mark the high and low of the last 20 to 50 candles as the initial range.
- Only consider the range more valid when it has reacted several times (at least 2 hits to the ceiling and 2 hits to the floor).
Note: The higher the timeframe, the more reliable the ranges are usually.
Range Trading Strategy with RSI + Level Confirmation
This strategy is suitable when the market is actually moving back and forth within a certain range.
- Specify the range limits (range high and range low).
- If the price approaches the ceiling and the RSI reaches higher territory (for example, near 70), look for signs of weakness.
- If the price approaches the bottom and the RSI drops (for example, near 30), look for signs of a reversal.
Risk Warning : In a real breakout, the RSI can stay in saturation for a long time; so only enter near the resistance levels and with a reasonable stop loss.
Strategy for filtering poor quality crosses with MACD
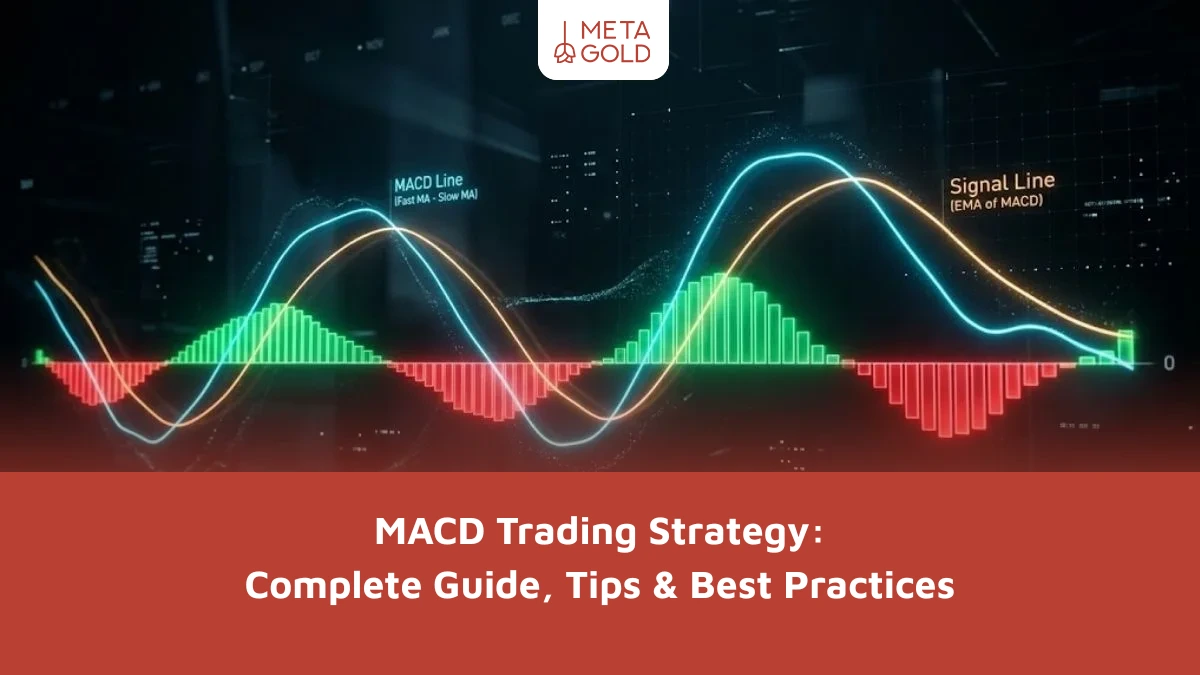
In a ranging market, the MACD often produces large, short-lived crosses. This trading method helps to reduce the risk of trading on poor quality crosses.
- If the MACD and signal lines intersect regularly around the zero line, the market is likely to be ranging.
- In this situation, don’t consider intersections as the only entry signal.
- Only consider it as supporting confirmation if the cross occurs at exactly the same time as the price hits the top and bottom of the range.
If you plan to enter more targeted trades after recognizing a ranging market, familiarizing yourself with a profitable Forex strategy can help you choose the type of entry, exit, and risk management appropriate to market conditions.
Tool selection table for detecting a ranging market
This table identifies the appropriate tool for determining whether the market is ranging, based on your scalping, day trading, or swing trading style.
| Trading Style | Recommended Tool(s) |
|---|---|
| Scalping | Bollinger Bands (Squeeze) + ATR |
| Day Trading | ADX + Bollinger Bands |
| Swing Trading | RSI |
Summary of the Range Market Detection Indicator
A ranging market is when the price mostly moves back and forth within a range, and trending entries can end up with consecutive stops. To make better decisions, first check for non-trend conditions with a range detection indicator like ADX or Bollinger Bands Compression. Then, mark the top and bottom of the range on the chart and only look for price reactions near the borders, not the middle of the range. Finally, open a demo trading account on MetaGold and test and error the appropriate ranging strategies so that your approach is flexible to any scenario.
Frequently Asked Questions about the Trend Detection Indicator
1. What does the Market Range Detection Indicator measure?
This indicator usually examines trend strength, volatility, and price action to determine whether the market has the energy to move in a clear directional trend.
2. Is there a best indicator to detect a ranging market?
No; no single tool is best for all situations, and a combination of multiple indicators usually provides more reliable results.
3. Which tools are used to identify trend ranges in TradingView?
Tools such as ADX, Bollinger Bands, Choppiness Index, and Donchian Channel are more common for filtering trendless markets.
4. Why do so many false breakouts occur in the market?
Because the trend strength is low and the price returns to the range with short-term crossings of the range.
5. How to trade with range?
Either trade only near the top and bottom of the range with short stops, or stay out of the trade altogether when conditions are uncertain.