In the financial markets, all the news, data, and trader sentiment ultimately change one thing: price. When you put aside the extra tools and read the language of price directly, you’ve entered the world of price action. In this article from MetaGold, we’ll explore what price action is and how you can follow the smart money in real time without getting bogged down in mathematical formulas and delayed signals. Whether you want to learn about price action and take swings, or you’re looking to trade long-term, this article will change the way you look at charts. Stay tuned.
What is price action?
Price Action is more than just a simple analysis method; it is the native language of the financial markets. In this style, we examine the chart naked, without any indicators, to see the purest data possible: the price itself. Price action traders believe that the current price reflects all the information in the world (from economic data to traders’ fear and greed), so we don’t need lagging tools like RSI or MACD to interpret it.
When we ask what price action is, we are really trying to understand the psychology behind each candle. Each bullish or bearish candle is the result of a real-life battle between buyers (bulls) and sellers (bears). Unlike other methods that try to predict with complex formulas, price action teaches you to identify and go with the winner by interpreting the strength and weakness of this battle in the moment.
The History of Price Action: From Charles Dow to ICT
You might think that the history of price action is recent, but its roots go back more than a century. Charles Dow, the father of technical analysis, was the first to say that “price reflects everything.” Later, Richard Wyckoff solidified the foundations of this science by studying market cycles and the behavior of the “composite man” (the market actor).
Today, masters like Al Brooks with his microscopic look at candles, Lance Beggs with his focus on market reality, and Michael Huddleston (ICT) with his concepts of liquidity and smart money have taken this method to the top.
The key difference between price action and classic technical analysis
Many people think that price action is the same as technical analysis, but the two approaches are fundamentally different. While classic technical analysis relies on auxiliary tools and complex formulas, price action focuses directly on price behavior. Let’s take a closer look at why professional traders prefer a blank chart:
- Eliminate the “Lag” Factor: Indicators (like moving averages) take past prices, combine them with a mathematical formula, and draw a line. This means they are always lagging behind the market. But price action happens in the moment. When a strong candle closes at a sensitive level, you get the signal right away, not 3 candles later!
- Avoid Analysis Paralysis : In classical methods, the RSI indicator may say “buy” but the MACD may say “don’t buy.” This contradiction causes confusion and hesitation for the trader. In price action, because you are only looking at one variable (price), decision-making is more decisive, clearer, and faster.
- Focus on the “cause” instead of the “effect”: Indicators are the shadow of the price (the effect), but the price itself is the reality of the market (the cause). Price action helps you face reality directly, not its shadow.
Types of Price Actions; Which Style Makes the Most Money for You?
The world of price action is vast. To understand the types of price action and which one suits your personality, you need to understand the main styles.
1. Classic Price Action
This style is based on support and resistance, trend lines, and classic patterns (such as head and shoulders or double tops).
- Suitable for : Those who are just starting out and want to learn the basics.
2. Supply and Demand Style
Instead of thin lines, we are dealing with “zones.” Sam Saiden is a pioneer of this style. The trader looks for areas where heavy buy or sell orders have been filled in the past, causing a price jump (rally or drop).
3. Al Brooks Style
Al Brooks believes that “every price tick counts.” This price action style is very detail-oriented and is great for scalpers working on lower timeframes, such as 5 minutes. He focuses on signal and entry candles.
4. Modern Price Action (RTM and ICT)
Known as “Smart Money,” these styles follow the footsteps of banks and hunt for the stop-losses of retail traders.
- RTM : Reading the market based on price nodes.
- ICT : Focus on banking algorithms, order blocks, and timed sessions.
Basic concepts of price action
To better understand what price action is in Forex or how it works in cryptocurrency, you need to know its alphabet. Below, we will go over these basic concepts.
1. Trends
- Bullish trend : Higher Highs, Higher Lows.
- Bearish trend : Lower highs, lower lows.
- Sideway trend : The price is stuck in a range. Recognizing this trend is crucial to avoid losses.
2. Applied candlestick theory
You don’t need to memorize hundreds of patterns in price action, but there are a few crucial ones:
- Pin Bar : A candlestick with a small body and a long shadow. It indicates a price reversal.
- Inside Bar : A candle that is embedded within the previous candle. A sign of a break and impending breakout.
- Engulfing : A candle that covers the entire previous candle. A sign of strong buying or selling power.
- Doji : A candlestick with the same opening and closing price. A sign of indecision.
What is Price Action Strategy?
It’s not enough to learn the definitions; you need to know exactly when to hit the buy or sell button. A price action strategy is about having a step-by-step roadmap for catching opportunities. Below, we’ll take a detailed look at 3 of the most reliable trading setups used by professionals.
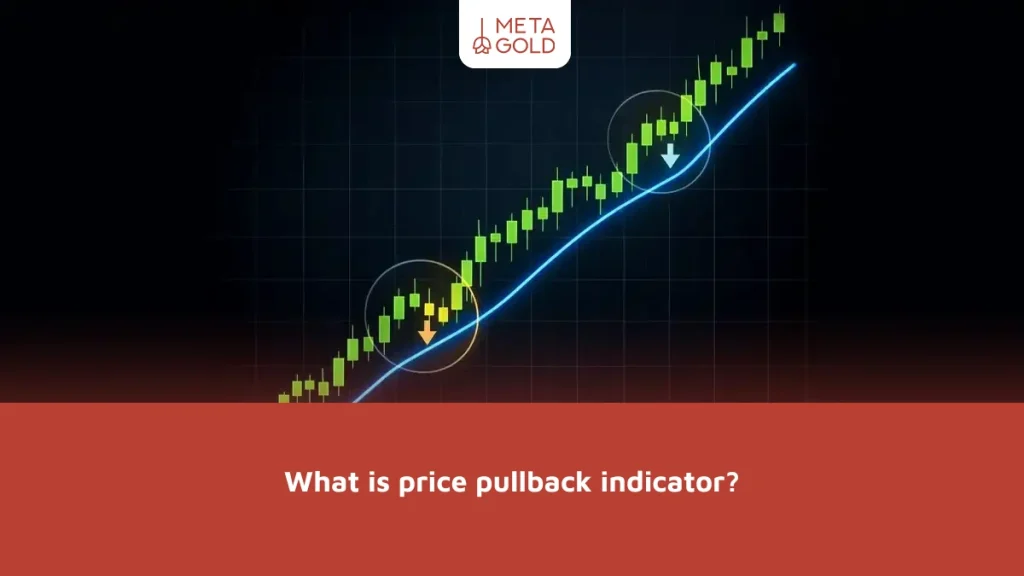
Strategy 1: The Breakout Pullback
This strategy is the safest gateway to the market. If you ask professional traders what the safest way to swing trade is, they will definitely tell you the pullback strategy because it allows you to ride the big market waves after the trend has stabilized and with very little risk.
Implementation steps:
- Identifying a Key Level : First, find a valid support or resistance level on the chart.
- Wait for the breakout : Wait for the price to break through this level with a strong candle (large body). Do not enter at the moment of the breakout, as it may be emotional and false.
- Pullback : Let the price slowly return to the level it broke. According to the law of “transformation of levels”, a level that was previously resistance should now play the role of support (and vice versa).
- Confirmation and firing : When the price returns to the level, look for a reversal signal (such as a pin bar or engulfing candle). Open the trade as soon as you see this signal.
Strategy 2: False Breakout or Price Trap
This is a popular strategy among modern style traders (like RTM). Sometimes the price breaks an important level, but this is just a trick on the part of the banks to raise the necessary liquidity.
Implementation steps:
- Trap : The price breaks a key support or resistance level and novice traders enter the market, believing the trend will continue.
- Quick Reversal : Immediately (usually on the same candle or the next candle), the price strongly reverses in the opposite direction and closes behind the level. This means that the breakout was not real.
- Smart Entry : This is a strong signal that the actual market direction is opposite to the breakout direction. After the price has returned to a safe range, you can enter the trade in the opposite direction of the breakout.
Strategy 3: Range Trading
The market doesn’t always trend; statistics show that about 70% of the time the market is in a neutral or “suffering” state. Instead of being a spectator during these times, you can profit from the tops and bottoms.
Implementation steps:
- Range box drawing : Identify two horizontal lines, upper (resistance) and lower (support), between which the price fluctuates.
- Buy at the bottom : Buy when the price reaches the lower line and shows a positive reaction (bullish candle).
- Sell at the ceiling : Sell when the price reaches the upper line and shows a negative reaction (bearish candle).
Golden tip : Never trade in the middle of the range, because your chances of winning or losing are 50-50.
Application of price action in financial markets
One of the biggest advantages of price action is that it is not limited to a specific market. It doesn’t matter if your chart is the EUR/USD currency pair, Bitcoin prices, or even steel stocks; wherever there are buyers and sellers, price action works. But how it is used in each market is slightly different, and we’ll cover two of them below.
Price Action in Forex
The Forex market is very technical due to its high liquidity (over $6 trillion per day). Price action patterns are very accurate in major currency pairs (such as EURUSD). Forex scalpers love price action because it increases their reaction speed.
Price Action in Cryptocurrency
If you are wondering what is price action in cryptocurrency? It must be said that in the crypto market, where volatility is high, the use of price action becomes even more vital. Indicators are often left out in Bitcoin pump and dumps, but price action helps you find areas of supply and demand and avoid falling into the trap of FOMO (fear of missing out).
Advantages and disadvantages of price action
No method is perfect. Let’s examine the pros and cons of price action to help you make the right decision.
Benefits of Price Action
- Free : You don’t need to purchase indicators or a premium subscription.
- Fast : Signals are issued instantly.
- Comprehensive : Works in the stock market, forex, gold, and crypto.
Disadvantages of Price Action
- Experience required : Distinguishing valid from invalid levels takes time and you need to gain experience.
- Subject to human error : Chart interpretation may be subjective (one person sees bullishness, another sees bearishness).
Final word
Understanding what price action is is the first step to becoming a trader who understands the “why” of market movements, not just the “how.” This approach will give you a new perspective to see the market clearly and realistically. Remember to focus on learning about price action instead of filling your charts with useless tools.
Frequently Asked Questions about Price Action
1. Are there any specific prerequisites for learning price action?
No, you just need to know the basic concepts of the stock market. Price action is a complete method in itself.
2. What is the best time frame for price action?
Price action works on all timeframes (fractals). However, for beginners, the 4-hour and daily timeframes have less noise and provide more accurate analysis.
3. What is the difference between price action and classic technical analysis?
Classic technical analysis relies heavily on tools and indicators, but price action focuses only on the raw price and candlestick behavior.
4. How long will it take me to master price action?
It depends on how long you practice. It might take a month to understand the concepts, but mastering how to execute them in the live market usually takes between 6 months and a year.