
Traders often wonder whether a recent correction signals the end of a strong move or is merely a temporary pause. The Tasuki Gap Pattern in technical analysis was developed to help answer this question. By combining a price gap and an incomplete correction, this pattern can provide a clue about the continuation or weakness of the trend; but only if its structure is understood correctly. In this article from MetaGold Broker, we first examine how the Tasuki pattern forms, then explain its validity conditions, trading methods, risk management principles, common mistakes, and application across different markets so that you can use it within a structured analytical framework.
What is the Tasuki Gap Pattern?
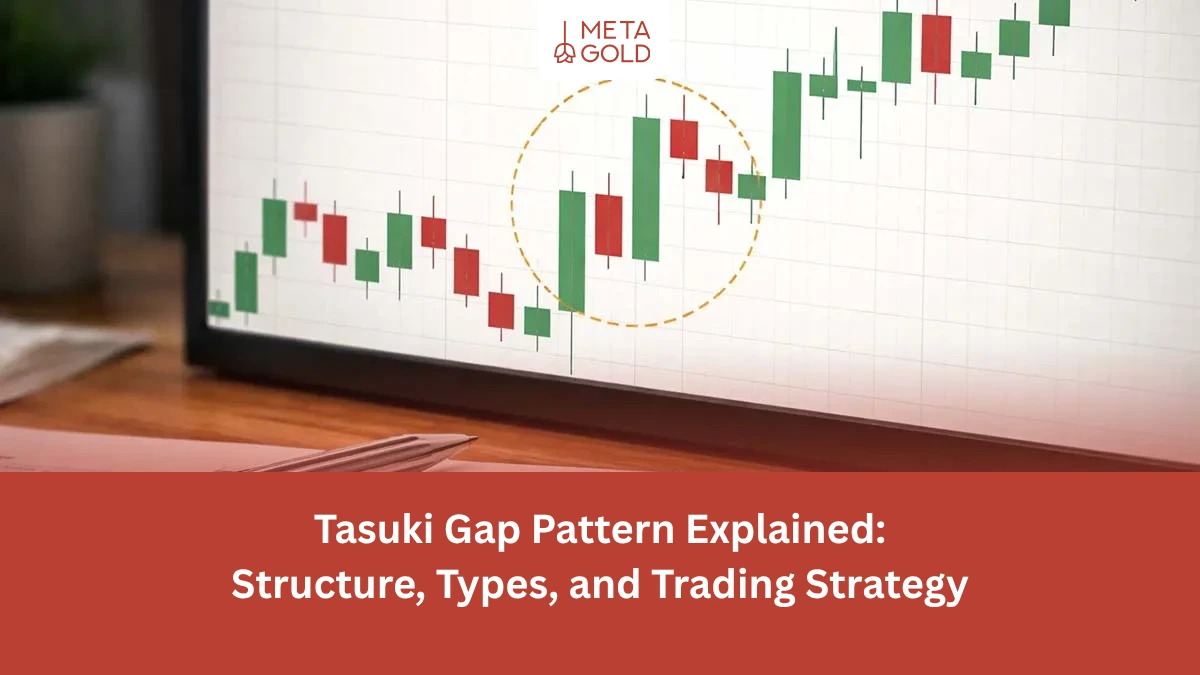
The Tasuki gap pattern in technical analysis is a three-candle continuation pattern that forms in the middle of an uptrend or downtrend and indicates that the dominant market movement is likely to continue. The structure of this pattern consists of two candles in the same direction as the trend, between which a price gap is created, then a third candle moves against the trend direction and enters the gap area but cannot completely fill it. This remaining part of the gap is a sign that the dominant side of the market is maintaining its superiority.
In fact, the Tasuki Gap pattern is a three-candle continuation pattern. It indicates that the short-term correction created does not have enough power to change the trend. In the bullish type, sellers cannot close the gap created, and in the bearish type, buyers are unable to completely fill the price gap. Therefore, this pattern is considered to measure the continuation of the trend and assess the temporary weakness of the opposing force in the market.
The Complete and Accurate Structure of The Tasuki Pattern
To understand this pattern professionally, we need to analyze each of its three candles separately:
First candle: confirmation of the active trend
The first candlestick is formed in the direction of the trend and has a relatively strong body. This candlestick confirms that the market is moving in a coherent manner. If the first candlestick is weak or doji, the validity of the pattern decreases. At this stage, the market is still under the control of the main capital flow.
Second candle: creating a gap and intensifying the movement
The second candle opens at a price gap from the first candle. This gap is called a gap. A gap can appear in two forms:
- Gap Up in an Uptrend
- Gap Down in a downtrend
A gap is formed by a sudden influx of high volume, economic news, or a break of a key level. This candle indicates an acceleration in the trend.
Third candle: correction and test of trend strength
The third candle closes against the trend and enters the gap area. But the key point here is that the gap does not close completely. At this moment, the market is testing the trend. If the correction can close the gap, it means that the opposing force has become strong. But if the gap is maintained, it means that the trend is still dominant.
The Origin and Place of the Tasuki Gap Pattern in Candlestick Analysis
The Tasuki Gap pattern comes from Japanese candlestick analysis, a centuries-old system first developed by rice traders in Japan. The core philosophy of candlesticks is based on understanding market sentiment.
In this framework, a price gap represents a sudden change in the balance of supply and demand. When a gap occurs, it means that market orders have been so one-sided that the price has not had the opportunity to trade within the previous range. In the Tasuki pattern, this gap is maintained, and its maintenance is a sign of continued imbalance in favor of the prevailing trend.
Types of Tasuki Gap Patterns
Types of Tasuki Gap patterns include:
- Upside Tasuki Gap
- Downside Tasuki Gap
We will examine each of these in more detail below:
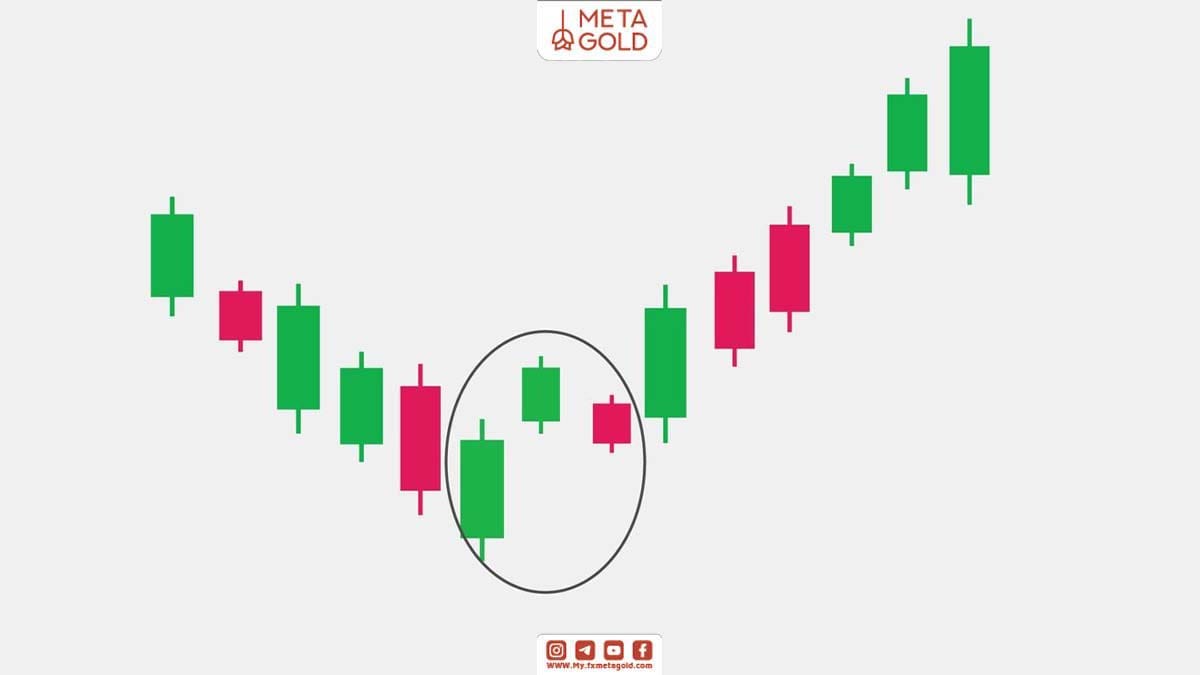
Upside Tasuki Gap
The Upside Tasuki Gap pattern forms in an uptrend. First, two bullish candles are seen with an upward gap, then a bearish candle enters the gap but does not close it. This indicates that the sellers have not been able to destroy the trend structure and the buyers are still in control of the market.
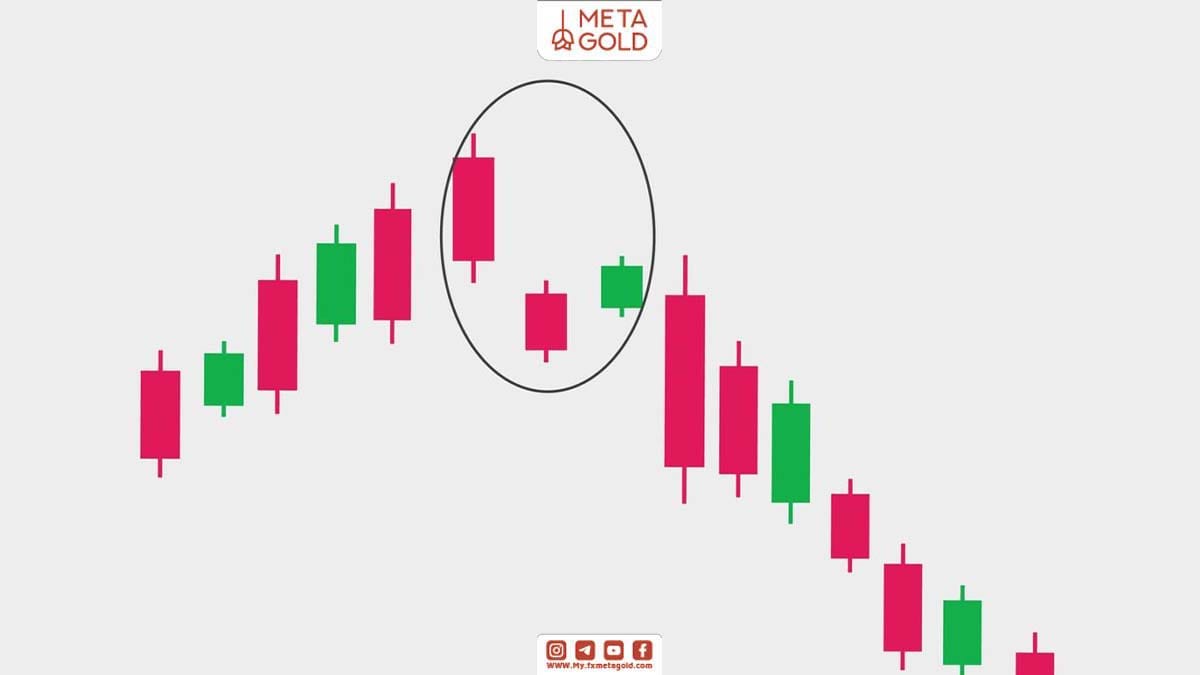
Downside Tasuki Gap
The Downside Tasuki Gap pattern appears in a downtrend. A gap is formed downwards and the third bullish candle tries to fill it but fails. In this situation, buyers do not have enough power to pull the price back and the selling pressure continues.
Psychology of the Tasuki Pattern
Understanding the psychology of this pattern will help you see it as more than just a chart pattern. In an uptrend, the gap indicates excitement and buying power. A short-term correction indicates that some traders are booking profits. But when the correction fails to fill the gap, it means that sellers are facing a supply shortage.
In a downtrend, the story is the opposite. The gap indicates strong selling pressure. The short-term correction is the result of bold buyers entering. But the inability to fill the gap means that these buyers are not competitive in terms of capital strength or order volume. In either case, the market is sending a message that the prevailing trend is still intact.
The Validity of The Tasuki Gap Pattern in Technical Analysis
In order for the Tasuki pattern to be valid and of high quality in technical analysis, it is necessary to meet several conditions:
- The prior trend must be clear and recognizable.
- The gap must be real and visible.
- The third candle should not completely close the gap.
- Trading volume increases in the second candle or in the overall structure.
- The pattern forms near important technical levels.
The more these conditions are met, the greater the likelihood of the pattern’s success.
Advanced Trading Strategy with Tasuki Gap Pattern
Professional entry is usually done in three ways:
- The first method is to enter after the third candle closes.
- The second method of entry is by breaking the top or bottom of the third candle.
- The third method is to wait for the fourth confirmation candle.
The stop loss is placed behind the third candle or behind the gap. This position makes sense because if the gap is completely closed, the pattern structure becomes invalid. Price targets can be set based on the continuation of the previous trend, resistance and support levels, or tools such as Fibonacci.
Advantages of Using the Tasuki Gap Pattern in Trading
The benefits of using the Tasuki pattern in trading include:
- Providing a trend continuation signal with specific behavioral logic
- Possibility of determining a reasonable and transparent loss limit
- Appropriate risk-reward ratio if capital management is followed
- Can be used in stock markets, indices and cryptocurrencies
- Simple but deeply analyzable structure
Disadvantages of Using the Tasuki Pattern in Trading
The disadvantages of using the Tasuki pattern in trading are:
- Underperforms in range markets
- False gaps may occur on lower timeframes.
- In markets with 24-hour trading, real gaps are less common.
- Requires verification with other tools
- May be confused with other candlestick patterns
Common Mistakes Traders Make when Using the Tasuki Gap Pattern
Most traders make the following mistakes:
- Enter before the third candle closes
- Trading without a clear trend
- Ignoring trading volume
- Not using stop loss
- Mistaking a deep correction for a valid pattern
- Ignoring the higher timeframe
Performance of the Tasuki pattern in different markets
In the stock market, gaps are more common due to the official opening and closing times, and therefore the Tasuki pattern is more common. In the forex market, due to the almost 24-hour trading, actual gaps are less common and are more often seen at the weekly open. In the cryptocurrency market, gaps form on exchanges with lower liquidity or during important news.
Capital management using the Tasuki gap pattern
No pattern has a 100% win rate and you need to protect your money using money management:
- Do not risk more than 1 to 2% of your capital on a single trade.
- Always have a reasonable profit-loss ratio.
- If the gap is completely filled, exit immediately.
- Avoid emotional entry.
Summary of the Tasuki gap pattern in technical analysis
The Tasuki Gap Pattern is a pattern for identifying trend continuation in bullish and bearish markets, combining a price gap with an incomplete correction and indicating temporary weakness in the opposing force. To use this pattern effectively, first identify the prevailing trend, then check the validity of the gap and trading volume, and determine entry and stop-loss points based on the three-candle structure. Combining the Tasuki pattern with complementary tools such as support and resistance levels, indicators or Fibonacci increases the chances of successful analysis. At the same time, risk management and capital limitation in each trade are required to prevent the effects of possible errors. To view the conditions of the types of trading accounts and choose the right platform, you can go to the page See MetaGold trading account types .
Tasuki Pattern FAQ
1. What is the Tasuki pattern and what is its use?
The Tasuki pattern is a three-candlestick continuation pattern that shows the continuation of the prevailing trend with a price gap and incomplete correction. This pattern helps traders identify temporary weakness in the opposing force and find potential entry points in the market.
2. What conditions make the Tasuki model valid?
The pattern is valid when the previous trend is clear, a real gap is created, the third candle does not completely close the gap, and the trading volume is appropriate. Also, the formation of the pattern near important technical levels increases its chances of success.
3. How to trade the Tasuki pattern?
Entry is usually made after the third candle closes or breaks its high/low. The stop loss is placed behind the third candle or behind the gap area, and price targets are set based on trend continuation or support and resistance levels.
4. Can the Tasuki pattern be combined with other tools?
Yes, combining the pattern with moving averages, the RSI indicator, support and resistance levels, and Fibonacci increases the chances of success.
5. In which markets does the Tasuki Gap pattern perform better?
The pattern works best in the stock market and indices, where real gaps occur more often. Gaps are less common in the forex market, and in cryptocurrencies, they occur more often during important news or on less liquid exchanges.