
Many traders face a common challenge when using indicators: receiving a lot of signals but making poor decisions. The MACD strategy is one tool that, if understood and used correctly, can provide a clearer view of the market trend and momentum.
In this article, we took a step-by-step look at how MACD works, what methods there are for using it, and how you can increase trading accuracy by combining multiple signals.
What is the MACD strategy and how does it work?
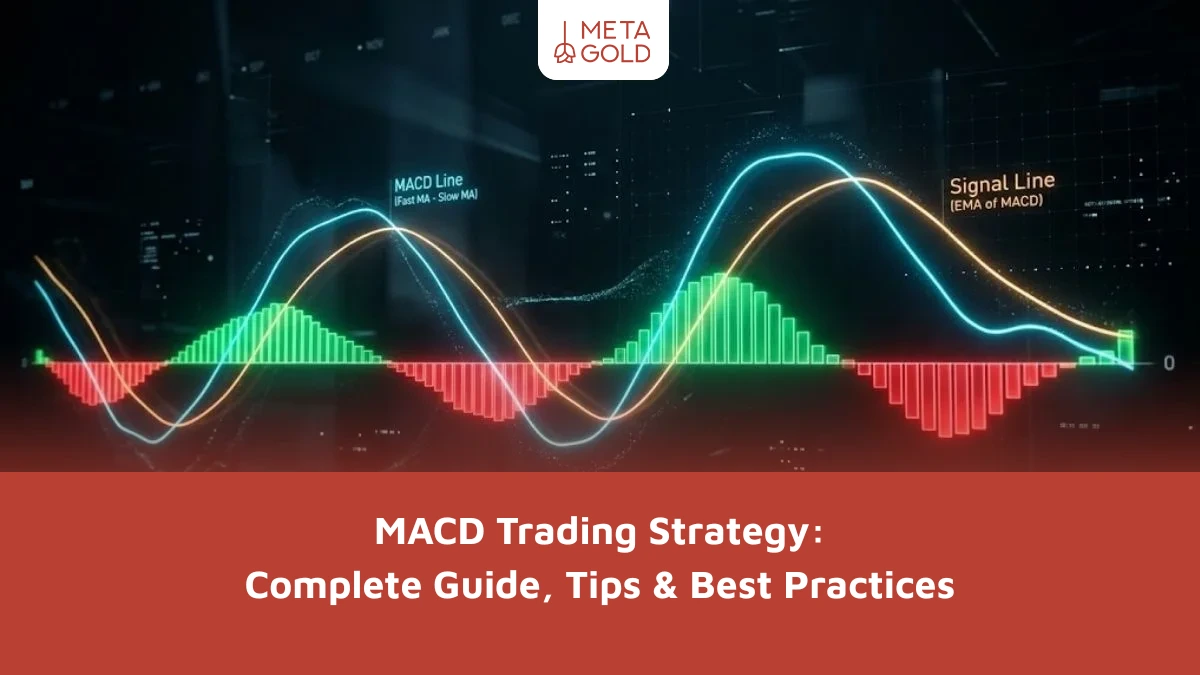
The MACD strategy is based on the MACD indicator, which is a technical analysis tool for analyzing market trends and momentum. This indicator helps traders identify the direction and strength of price movement by comparing two exponential moving averages (EMAs). The MACD structure consists of three main parts:
- The MACD line is calculated by subtracting the 26-period EMA from the 12-period EMA.
- The signal line is the 9-period EMA of the MACD line.
- The histogram shows the distance between the MACD line and the signal line.
Understanding these components is essential to using the strategy correctly. To learn more, you can read the article on the MACD indicator.
Learning the MACD strategy in trading (step by step)
In this section, we will explain the MACD strategy in a practical way, using examples that are close to real trading conditions. The goal is not just to recognize the signals, but to learn when to trust them and how to use them in decision-making.
Step 1: Identify the market trend
First, you need to identify the current market condition. MACD does not create a trend on its own; it helps confirm an existing one. If the price is moving in a certain up or down trend, the signals of this indicator are more valuable. On the contrary, in a ranging or sideways market, crossovers occur more frequently, but they are less reliable. For this reason, the first step is to examine the structure of the price movement and look for positions only in the direction of the main trend.
Step 2: Signal Line Crossover Analysis (Entry Signal)
One of the most important parts of working with MACD is paying attention to the intersection of the MACD line and the signal line. When the MACD line crosses above the signal line, it indicates strengthening bullish momentum and could be a buying opportunity. Conversely, when the MACD line crosses below the signal line, it can indicate increasing selling pressure.
But here’s the important thing: not every crossover is worth trading. If this crossover occurs against the main trend, it may be a false signal. For this reason, combining MACD crossovers with trend analysis is the basis of many trading strategies and can even be considered part of the best trading strategy.
Step 3: Use the zero line to confirm
One way to filter signals is to pay attention to the position of the MACD relative to the zero line. When the indicator is above zero, the overall momentum of the market is bullish and buy signals are more valid. Conversely, when the MACD is below the zero line, the focus should be on selling.
In practice, when the line crossover is accompanied by a crossing of the zero line, the signal becomes stronger and the trend is more likely to continue.
Step 4: Histogram Analysis (Momentum Strength)
The MACD histogram is more than just a visual display. It shows you whether the strength of the trend is increasing or decreasing. When the bars are larger, it means the distance between the lines is greater and the momentum is stronger.
On the other hand, shrinking bars can be the first sign of a weakening trend, even before a cross occurs. For this reason, many professional traders use the histogram to detect changes early.
Step 5: Check for divergence (reversal signal)
Divergence is one of the most important signals that MACD provides, especially at the end of trends. When the price is making a new high or low, but the MACD does not confirm this move, we can suspect a weakening trend.
These situations can appear before the market changes direction and help traders spot changes earlier than others. Of course, divergence alone is not enough and is best used in conjunction with other signals.
Various ways to use MACD in trading
To use MACD effectively, it is not enough to simply understand its structure; you also need to know in what ways this indicator can be used for analysis and decision-making. Depending on their trading style, traders use different methods to extract signals from MACD, each of which has a specific application.
- Signal line crossover: This is the most common use of MACD. In this case, traders use the intersection of the MACD line and the signal line to identify entry and exit points.
- Zero line crossover: When the MACD crosses above the zero line, it indicates a change to bullish momentum. A crossing below the zero line is also considered a bearish signal.
- Divergence: Divergence occurs when the price and MACD move in opposite directions. This can be a sign that the current trend is weakening and the market may change direction.
- Histogram analysis: The histogram shows the distance between the MACD line and the signal line, and through it, the strength or weakness of the trend can be assessed.
The Best MACD Strategies for Traders
Choosing the best MACD strategy depends on various factors such as trading style, timeframe and market conditions. However, some methods are more popular among traders due to their simplicity, accuracy and practical use. Many sources introduce different MACD strategies, but in practice, a few key models are most used. Below, we will examine in detail the most important and practical MACD strategies.
MACD Momentum Strategy Using Histogram
In this method, the main focus is on the MACD histogram, which shows the strength of the price movement. When the histogram bars become larger, this indicates increasing momentum and the possibility of a continuation of the trend. Conversely, when the bars become smaller, this can be a sign of decreasing strength and the possibility of a correction. Traders use these changes to anticipate MACD crossovers earlier. This strategy works best in trending markets.
MACD Line Crossover Strategy for Quick Entry
The crossover strategy is one of the simplest and most widely used methods in MACD. In this method, when the MACD line crosses the signal line upwards, a buy signal is issued, and when the MACD line crosses below the signal line, it may generate a sell signal. This method is suitable for beginners due to its simplicity, but to increase accuracy it is better to use it in the direction of the trend. Otherwise, especially in ranging markets, the probability of receiving false signals increases.
MACD Pullback Strategy in Strong Trends
In this method, instead of entering at the beginning of a trend, the trader waits for a price correction (Pullback). Then, upon seeing confirmation from the MACD, they enter a trade in the direction of the main trend. This approach allows for better entry prices and reduces risk. Combining a pullback with a MACD cross or a rising histogram creates stronger signals and is very useful for trend trading.
Custom MACD settings strategy for different conditions
The default MACD setting is 12-26-9, but some traders change these values to make the indicator respond faster or reduce market noise. For example, in short-term trading, shorter periods are used to receive signals faster. Conversely, for long-term trading, slower settings help reduce false signals. Choosing the right settings depends on the type of market and trading strategy.
Combining MACD with other indicators
Using MACD alone can give you false signals, so it is important to combine it with other tools. One of the most common combinations is using RSI. In this case:
- MACD shows the direction and strength of the trend
- RSI indicates overbought or oversold conditions
Advantages and disadvantages of the MACD strategy
Understanding both the benefits of the MACD strategy and its limitations helps traders make more accurate and realistic decisions and avoid misuse of this indicator.
The main advantages of the MACD strategy are that it is easy to understand, useful for identifying trend momentum, and suitable for combining with other indicators. However, its main disadvantages are delayed signals, false signals in sideways markets, and the need for additional confirmation.
Practical tips to increase the accuracy of the MACD strategy
For the MACD strategy to perform better in trading, it should be used in combination with risk management principles. Many common mistakes occur when a trader enters a trade without considering market conditions or necessary confirmations. Following the tips below can significantly increase the accuracy of the signals.
- Using a timeframe that suits your trading style
- Combining MACD with support and resistance levels
- Avoid trading in trendless markets
- Using Stop Loss to Manage Risk
- Maintaining an appropriate risk-reward ratio (e.g. 1:2)
By following these tips, you can filter MACD signals and avoid false entries. Combining technical analysis with risk management plays a key role in improving trading results.
Summary of the MACD strategy
Using the MACD strategy will be effective when you do not consider it solely as a signaler, but use it in conjunction with trend analysis, histograms, and complementary confirmations. To begin with, first understand the MACD structure well, then use crosses only in the direction of the trend, and filter the signals with the help of tools such as support and resistance levels. Paying attention to the advantages and limitations of this method plays an important role in avoiding trading errors.
MACD Strategy FAQ
1. What type of market is the MACD strategy best suited for?
This strategy works better in trending markets because MACD is designed to detect momentum and direction. In ranging markets, the probability of false signals is higher.
2. How to filter MACD signals?
The best approach is to use additional confirmations such as the zero line, histograms, and support and resistance levels. This will reduce false signals.
3. Is MACD alone enough for trading?
No, using MACD alone is not recommended. Combining it with other tools increases the accuracy of analysis and makes better decisions.
4. What is the use of divergence in MACD?
Divergence is usually a sign of a weakening trend and a possible change in market direction. This signal is most important at the end of trends.
5. What are the best MACD settings?
The default setting (12-26-9) is suitable for most markets, but traders can change it based on their trading style.