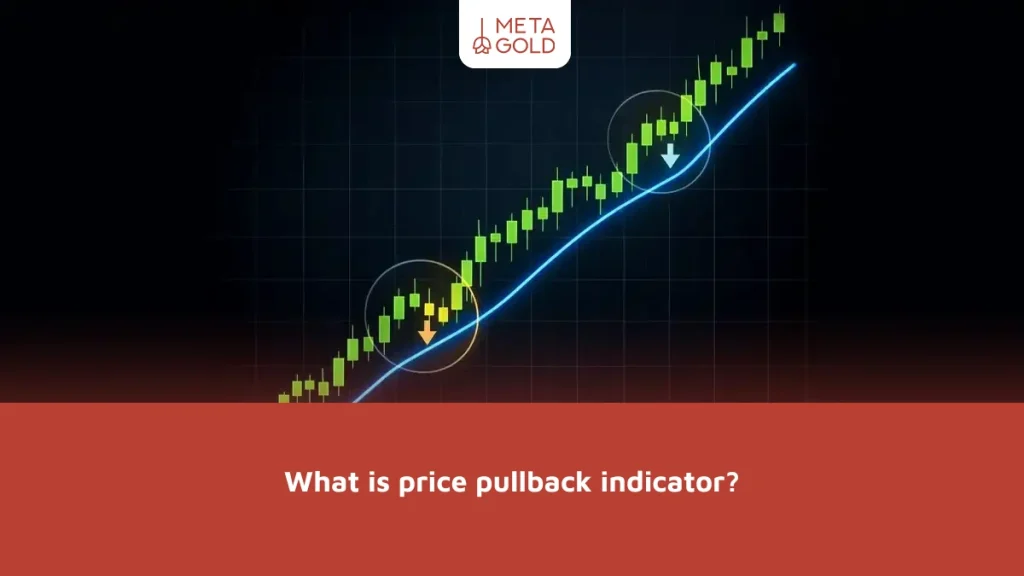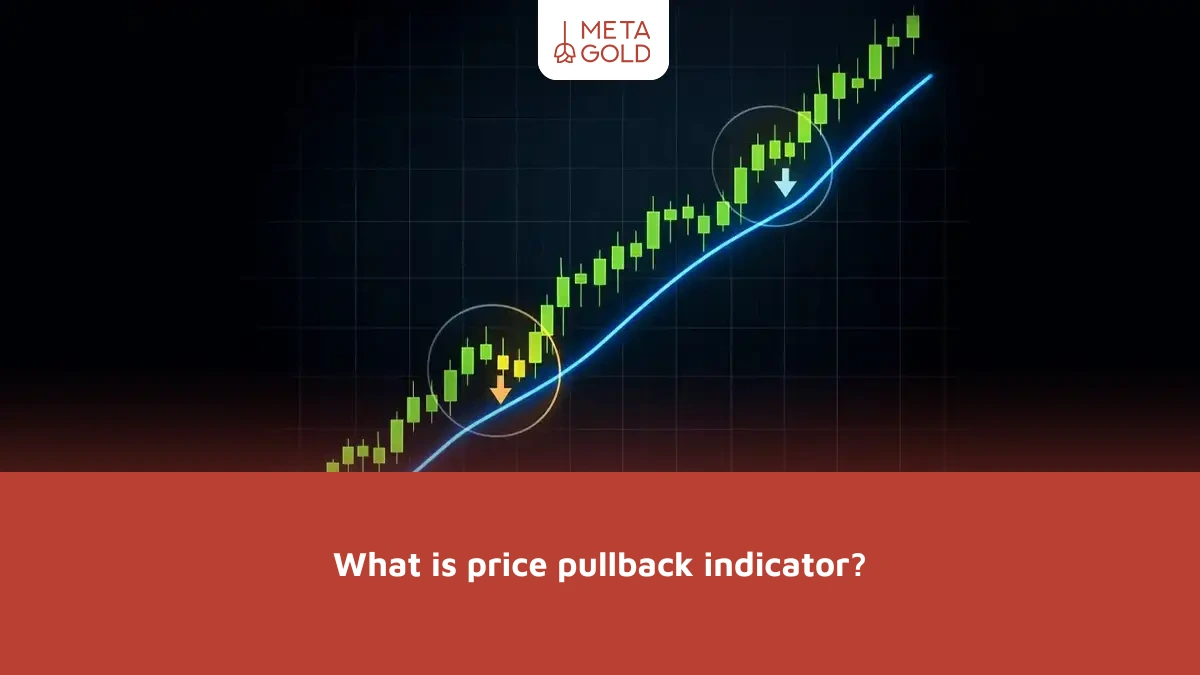

What is the retracement indicator, and how does it help identify entry points in trading?
A retracement indicator is an analytical tool based on price, volume, market structure, or trend data, used to identify areas of potential temporary price corrections. These indicators do not provide a definitive signal on their own, but rather indicate conditions under which a retracement is more likely to occur.
In fact, it’s worth noting that a pullback is not a fixed, self-contained pattern with a completely clear structure. That’s why there is no magic indicator that can accurately identify all pullbacks. What a trader needs is a set of tools that better illustrate the structure of the trend, as well as correction points and the likelihood of the movement continuing. So, when we talk about a retracement indicator, we may be referring to a custom indicator or a set of complementary tools.
Why do traders use the retracement indicator?
The primary goal of using these tools is to reduce entry risk. When the price moves in the direction of the trend, entering at the peak of the movement does not offer an appropriate risk-to-reward ratio. On the other hand, if a trader is able to spot a temporary price correction, they have the opportunity to enter the trade at a more reasonable point.
One of the most important advantages of the retracement indicator is that it promotes discipline in analysis. Wrong decisions are often made in the market as a result of rushing, fear of missing out, and trading based on emotion. When a trader uses a dedicated tool to confirm retracement conditions, their decisions become more disciplined and structured. This is crucial for those who trade based on a pullback strategy.
Is a single indicator enough to identify a pullback?
No, the best results are achieved when using the retracement indicator in conjunction with price action, support and resistance levels, trend lines, and risk management. Not every move that initially appears to be a retracement remains temporary. Sometimes the price retraces briefly and then resumes the prevailing trend, while in other cases, the move deepens and develops into a genuine trend reversal.
Therefore, understanding price action in conjunction with technical tools is essential.
The Best Tools and Indicators for Identifying Price Pullbacks
Several widely used tools and indicators can help traders identify potential pullbacks. Below, we’ll review the most important ones.
1. Identifying a Pullback Using a Moving Average
Moving averages are among the most common tools for identifying price corrections within a trend. In an uptrend, after the price rises, it corrects to approach the moving average and then returns to its original trend. The same logic applies in a downtrend.
The 20-, 50-, and 100-period moving averages are most commonly used for this purpose. For example, many traders watch for a pullback toward the 20- or 50-period exponential moving average during an uptrend, as this may provide a potential trend-continuation setup if the price holds and turns higher.
2. Identifying a Pullback Using the Relative Strength Index (RSI)
The Relative Strength Index (RSI) is not a direct tool for identifying price pullbacks, but it helps determine the extent of a correction. For example, if the overall trend is bullish and the RSI falls to the middle of its range during a correction without entering oversold territory, this may be a sign of a healthy pullback. RSI divergence may provide supporting evidence that the correction is losing momentum, but it should not be treated as a standalone confirmation signal.
3. Using the MACD indicator to confirm corrections and trend continuation
The MACD indicator is commonly used to measure trend momentum and confirm the continuation of a trend. During price pullbacks, this indicator can signal whether the current correction is merely a temporary dip in trend strength or whether there is a possibility of a genuine trend reversal. If MACD momentum turns back in the direction of the prevailing trend after the correction—for example, through a bullish crossover during an uptrend—some traders may view this as supporting evidence of trend continuation.
4. Identifying Retracements Using Fibonacci Retracements
Although Fibonacci is not an indicator in the traditional sense, it is one of the most widely used tools for identifying price retracements. The 38.2%, 50%, and 61.8% levels are commonly monitored as potential support or resistance areas where the price may react or resume the prevailing trend. When a Fibonacci level aligns with a support or resistance area or a moving average, the resulting setup may carry greater analytical significance.
5. Identifying Price Pullbacks Using Bollinger Bands
Bollinger Bands indicate the extent of price volatility and its deviation from the mean. In strong trends, when the price returns to the middle band after a sharp move, some traders view this as a pullback. A price reaction near the middle or outer band may provide supporting evidence that a correction is ending, but it does not confirm this on its own.
6. Custom Pullback Indicators
Some platforms offer tools with names such as the Retracement Indicator, Trend Correction Indicator, or “Buy on the Dip/Sell on the Rally.” These indicators typically identify potential pullback zones by combining several conditions, such as the trend direction, the price’s distance from the average, the correction ratio, and the behavior of Japanese candlesticks. However, using them without understanding market structure can be misleading.
If you plan to use these tools in your analysis, you can download a collection of useful indicators from the Forex Indicators Download section and install them on your trading platform.
How to Use the Retracement Indicator in TradingView
On TradingView, traders can use a variety of built-in and community-created tools to analyze potential retracements. On this platform, you can use built-in indicators and view public indicators published by other users.
Steps for Using the Retracement Indicator on TradingView
- Identify the main trend.First, you need to determine whether the market is in an uptrend or a downtrend. Without identifying the trend, there’s no point in looking for a price correction.
- Add a tool such as EMA or VWAP.Add a tool such as an EMA—or VWAP for intraday analysis—to help assess the trend and identify potential price-reaction areas.
- Search for indicators related to pullbacks or trend continuation.In the Indicators section, you can search for terms such as “pullback,” “correction,” or “continuation of the trend.”
- Compare the indicator’s result with the price movement.If the price reaches the key level and reversal candlesticks form, the validity of the analysis increases.
- Set clear take-profit and stop-loss levels.Even the best indicators cannot guarantee 100% success, so risk management is essential.
It is important to note that on the TradingView platform, you should not rely entirely on the buy or sell signals generated by the indicator. Many generic scripts may not be suitable for all markets or all time frames. It is best to test them first on a demo account or by backtesting them on historical data.
The Best Way to Use the Retracement Indicator
To get the most out of the retracement indicator, it is recommended to use it within a clear analytical context. The logical approach is to first identify the trend using the structure of highs and lows or moving averages. Then, wait for the price to correct to a significant area. After that, the entry point is selected with the help of the indicator and confirmed by price action.
For example, in the case of an uptrend, we can consider this scenario:
- The price is above the 50-period exponential moving average.
- The price pulls back toward a support level or the exponential moving average.
- The Relative Strength Index (RSI) declines, but the broader trend remains intact.
- A bullish reversal candle forms.
- The trader enters after confirmation and sets a clearly defined stop-loss.
This approach means that the indicator plays only a supporting role rather than serving as the sole basis for the trading decision.
Advantages and Disadvantages of Retracement Indicators
| Pullback Indicator Limitations | Advantages of the Pullback Indicator |
|---|---|
| Possibility of false signals in ranging markets | Helps identify lower-risk entry points |
| High dependency on indicator settings | Improves discipline in analysis |
| Requires confirmation through price action | Reduces emotional trading decisions |
| Ineffective during news events and periods of extreme volatility | Can be used across different markets |
| — | Can be combined with other technical tools |
Conclusion: Is the Retracement Indicator Right for Your Trading?
The Retracement Indicator is a tool that helps traders identify temporary price corrections within a trend and make better entry decisions. However, it should not be viewed as a magic bullet or a standalone tool. It is recommended to use the Retracement Indicator in conjunction with trend structure, support and resistance levels, candlestick patterns, and risk management.
Similarly, using a retracement indicator on a trading platform is most effective when the user does not simply rely on the ready-made signal but also understands the logic behind it. If these tools are selected and combined correctly, they help identify more suitable opportunities and reduce trading errors.