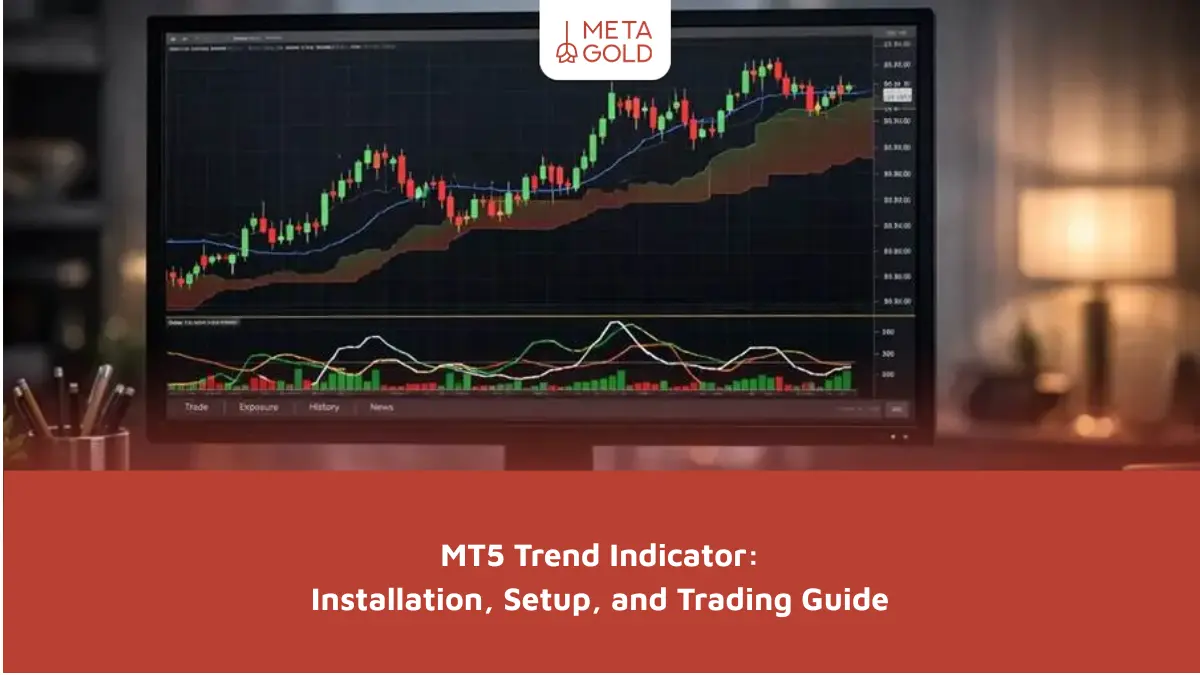

What is the Trend Detection Indicator on the MetaTrader 5 platform?
A trend indicator measures the strength of a trend and identifies or confirms its direction. A trend is the general direction of price movement. The market typically moves in three main patterns:
- Uptrend: The price is rising, with progressively higher highs and higher lows forming. Buyers have more strength than sellers, and the market is trending upward.
- Downtrend: The price is moving lower, with progressively lower highs and lows forming. In this case, selling pressure outweighs buying pressure, and the market tends to push the price lower.
- Sideways Trend (Range): Buying and selling pressure are roughly balanced, and the price moves within a specific range without a clear trend. The price fluctuates within a certain range, and no specific trend emerges.
Trend-identification indicators help determine the prevailing market trend with greater accuracy and identify entry and exit points more effectively. For this reason, these indicators are also used in technical analysis.
Types of Trend Identification Indicators on the MetaTrader 5 Platform
The MetaTrader 5 platform is one of the most popular and widely used trading platforms in the forex market. In this section, we’ll introduce you to some of the most common trend-identification indicators in MetaTrader 5:
Moving Average
The moving average indicator shows the general market trend by calculating the average price over a specific time period (for example, 20, 50, or 200 candles). However, because it relies on past data, it is slow to respond to rapid changes in the market.
Ichimoku Cloud
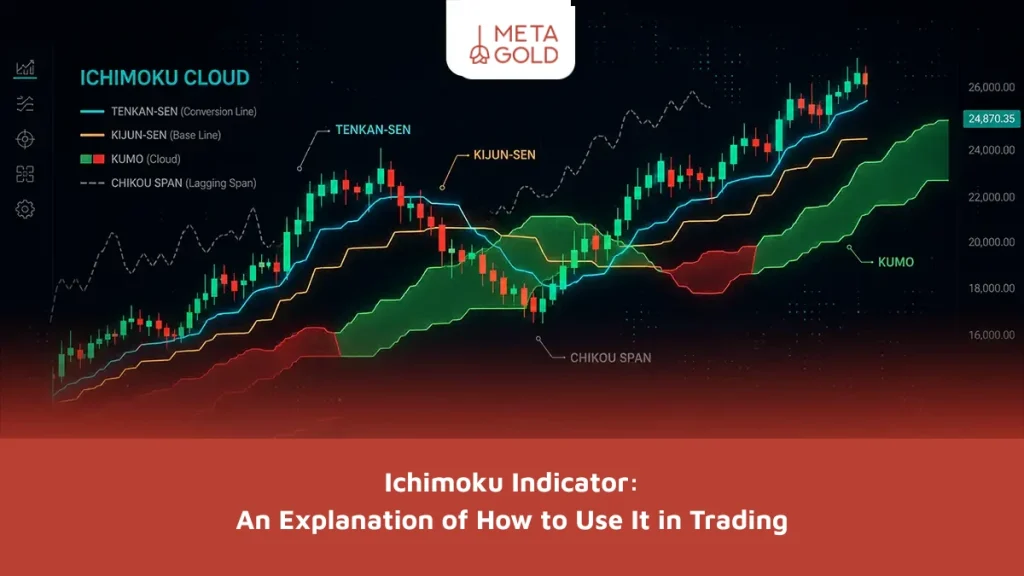
The Ichimoku indicator is a versatile tool; it identifies the direction and strength of a trend, as well as support and resistance levels. It is useful for identifying breakout points, but it is more complex than moving averages.
Trend Spotters
This is a custom indicator for the MT5 platform. This tool uses an arrow or a color change to signal the start of a trend. It is useful for providing entry signals, but it is not sufficient for analyzing the structure and strength of a trend.
Autotrendlines Indicator
This tool is a custom indicator for the MetaTrader platform that automatically draws trend lines and highlights the overall market trend. The indicator focuses on showing the structure of the trend, rather than identifying precise entry or exit points.
Average Directional Index
The ADX measures trend strength on a scale from 0 to 100, but it does not indicate the direction of the trend. Values above 25 indicate a strong trend, while values below 20 indicate a weak trend or the absence of a trend.
You’ll find a more comprehensive list of indicators in the article “The Best Trend-Detection Indicators.”
A Step-by-Step Guide to Installing the Trend Detection Indicator on the MetaTrader 5 Platform
Now it’s time to add the appropriate indicators to your MetaTrader 5 platform. In MetaTrader 5, some indicators are available by default, such as moving averages and the Ichimoku indicator, but to install custom indicators such as Trend Spotters and Autotrendlines, follow these steps:
Step 1: Download and install the indicator
- Download the desired indicator from the “Download Forex Indicators” section on the MetaGold website or other reputable websites.
- Indicators are usually provided in .ex5 or .mq5 format.
- Save the file in an easily accessible location (such as your desktop).
Note: Use only trusted sources to avoid installing malicious files.
Step 2: Copy the file to the indicators folder
- Access the MetaTrader 5 environment.
- Click “File” on the top menu.
- Select the “Open Data Folder” option.
- Go to MQL5 → Indicators.
- Copy the downloaded file to this folder.
After copying the files, close MetaTrader once and then restart it.
Step 3: Add the indicator to the chart
- Open the Navigator window from the View menu.
- In the Indicators section, look for the installed indicator.
- Drag and drop it onto the chart, or double-click it.
- The Settings window opens.
The indicator is now active on the chart.
Step 4: Adjust the parameters for optimal performance
In the Settings window, you can change the following:
- Inputs: Specify the time period based on the number of candles (for example, 14, 50, or 200)
- Colors: Change the color of lines or arrows
- Levels: Specify the numerical levels (for indicators such as ADX). After applying the settings, click “OK.”
If you also do your analysis in TradingView in addition to MetaTrader 5, there’s no need to worry. You can also use the Trend Detection indicator in TradingView.
Important Tips for Using Trend Indicators on the MetaTrader 5 Platform
It is not enough to simply add indicators to a chart in the MetaTrader 5 platform; how they are configured and combined plays a key role in determining the quality of the analysis. To achieve the best results, please keep the following settings in mind:
Settings Suitable for the Time Frame
- On short-term time frames, such as 5 and 15 minutes, it is better to use shorter moving average periods, such as 10, 20, or 50 candles, to get a faster response.
- On higher time frames (4-hour or daily), consider longer periods such as 100 or 200 candles, which better illustrate the main trend.
A smart combination of indicators for a more accurate analysis of market trends
Each indicator provides specific information, and well-chosen combinations of indicators can increase the accuracy of the analysis. For example:
- Moving Average Indicator to Determine the Trend Direction + Relative Strength Index to Identify Entry Points in the Same Direction
- Automatic Trend Lines to Identify Trend Structure + Trend Capture Tool to Determine Entry Timing
Remember that each indicator plays a different role in analysis. Avoid using several similar indicators at the same time (for example, three types of moving averages); this will only increase confusion.
How Can You Avoid False Signals in Trading?
Follow these steps to avoid false signals:
- Determine the market condition (trend or range): The likelihood of a false signal is higher in a neutral market. (Use the Average Directional Index (ADX) to help.)
- Get confirmation from multiple time frames: Always check the trend direction on a higher time frame; if the signal is not consistent, there is a possibility of error.
- Do not make a decision until after the candle closes: Many signals are not valid until after the candle closes.
- Confirm the signal using a complementary tool: Instead of using several similar indicators, use each indicator in its proper context.
- Match the signal with the price structure and key levels: If the signal is generated near a key support or resistance level or in the middle of a range, be more cautious, as the likelihood of a reversal or a false breakout is high.
In volatile market conditions, the ADX can help measure trend strength, but it should be combined with price action or other tools to confirm trend changes.
Comparing Trend Indicators with Oscillators
Oscillators are best suited for range-bound markets, while trend indicators perform better in markets with a clear trend. Indicators and oscillators are two different tools, and they are not expected to perform the same way.
| Criterion | Trend Indicators | Oscillators |
|---|---|---|
| Purpose | Identify the direction and continuation of price movement | Measure momentum and identify overbought and oversold areas |
| Best Performance | In markets with a clear trend | In sideways markets or during trend corrections |
| Response Speed | Relatively slower and may lag | Faster and more sensitive to changes |
| Main Use | Filter trade direction and follow the trend | Identify potential reversal or correction points |
| Error Level | Weak performance in sideways markets | May generate early signals during strong trends |
Conclusion: How Can You Get the Most Out of Trend Indicators?
Each of the trend-detection indicators in MetaTrader 5 plays a specific role in the analysis process: the moving average to identify the general trend, the ADX to measure trend strength, and the Trend Catcher to select an entry point.
However, no single indicator is perfect on its own, and the likelihood of error can be reduced by combining different tools, analyzing multiple time frames, and paying attention to price structure. Nevertheless, it is advisable to test trend-following indicators on a demo trading account before using them on a live account.
Ultimately, results depend more on your ability to interpret data and manage risk properly than on indicators alone—and that is what distinguishes emotional decision-making from rational trading.