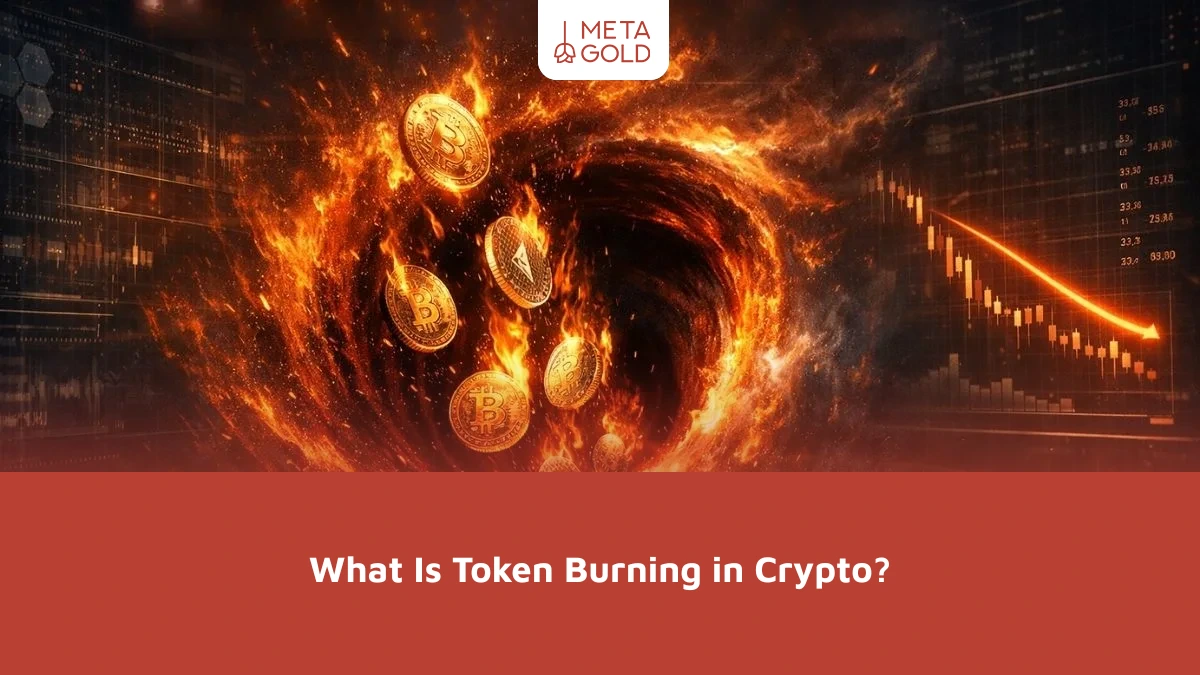
What is token burning in cryptocurrency? And why do projects permanently remove part of their assets? Many users assume that any decrease in supply means a definite increase in price, while the relationship between supply, demand, and value is much more complex than this simple perception. In this article, we
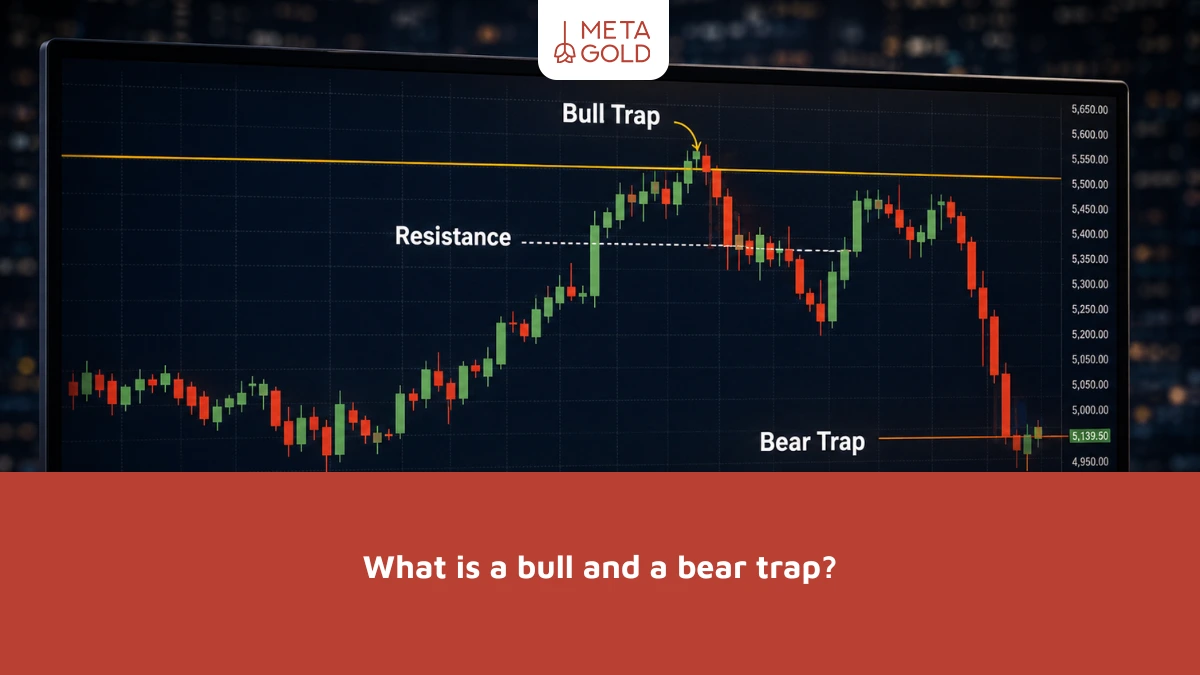
In financial markets, one of the most common reasons traders lose money is by entering moves that seem very obvious and logical on the surface, but are actually “deceptive moves.” Many people enter a trade after a support or resistance break, only to find out later that they have fallen
If you plan to trade global indices, you’ve probably wondered what the Dow Jones symbol is in Forex. And how is it different from stock trading? Many traders know that the Dow Jones is one of the most important U.S. stock market indices, but they may not fully understand its
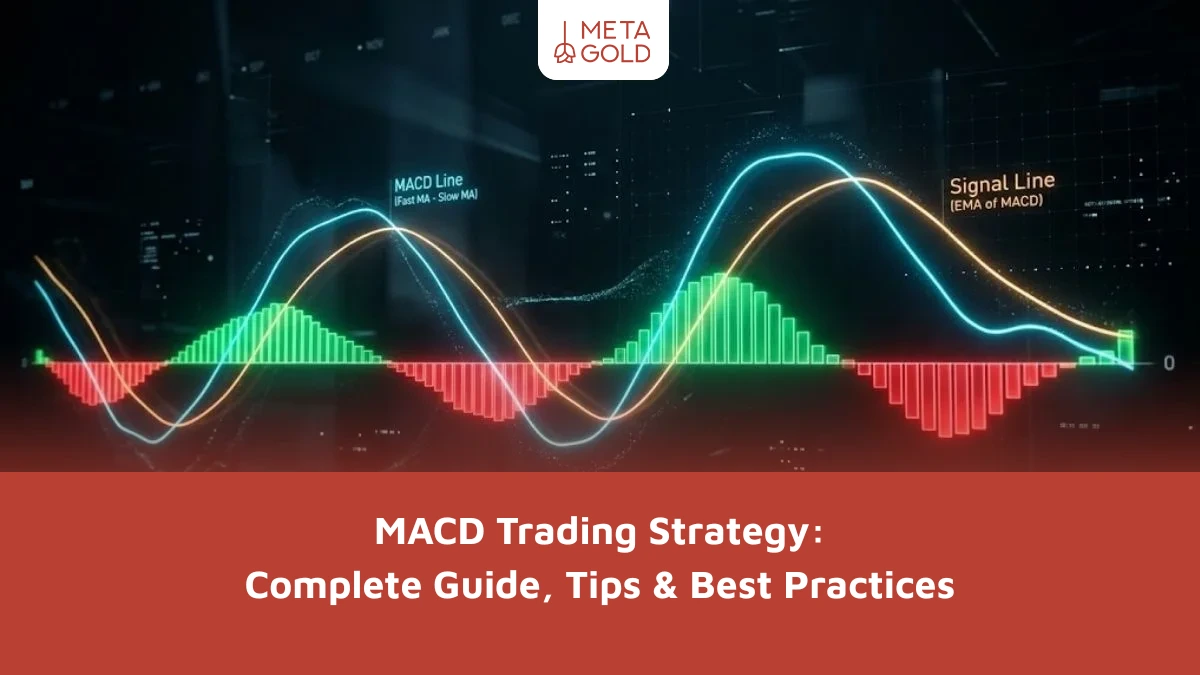
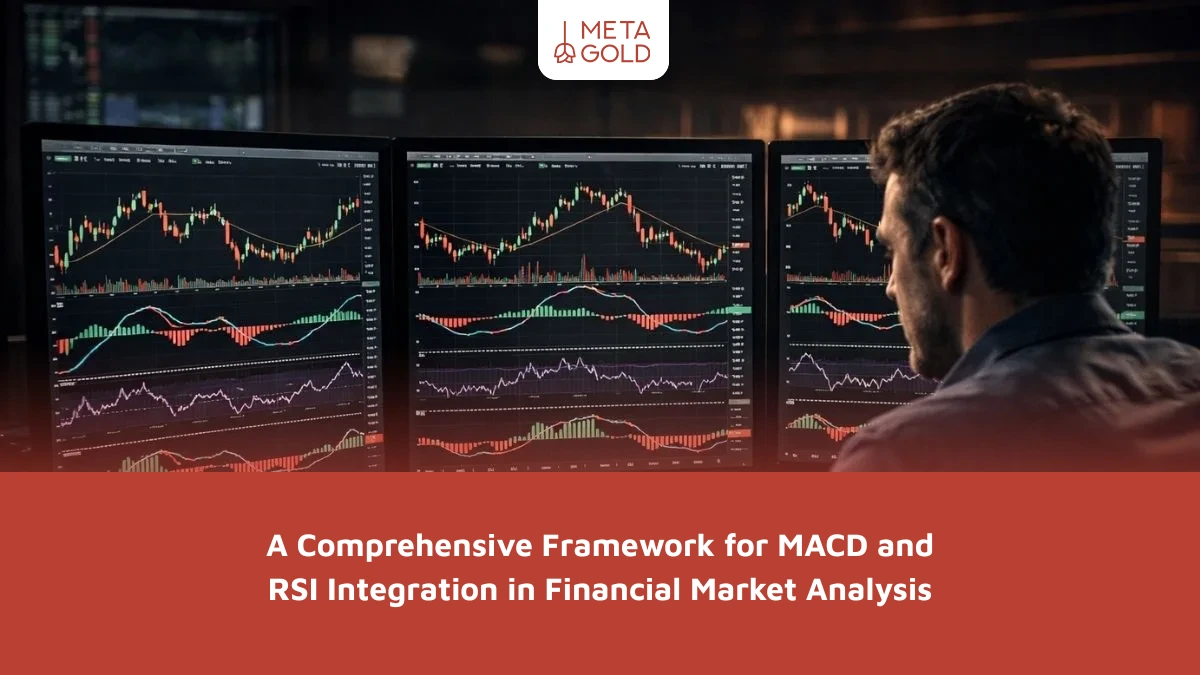
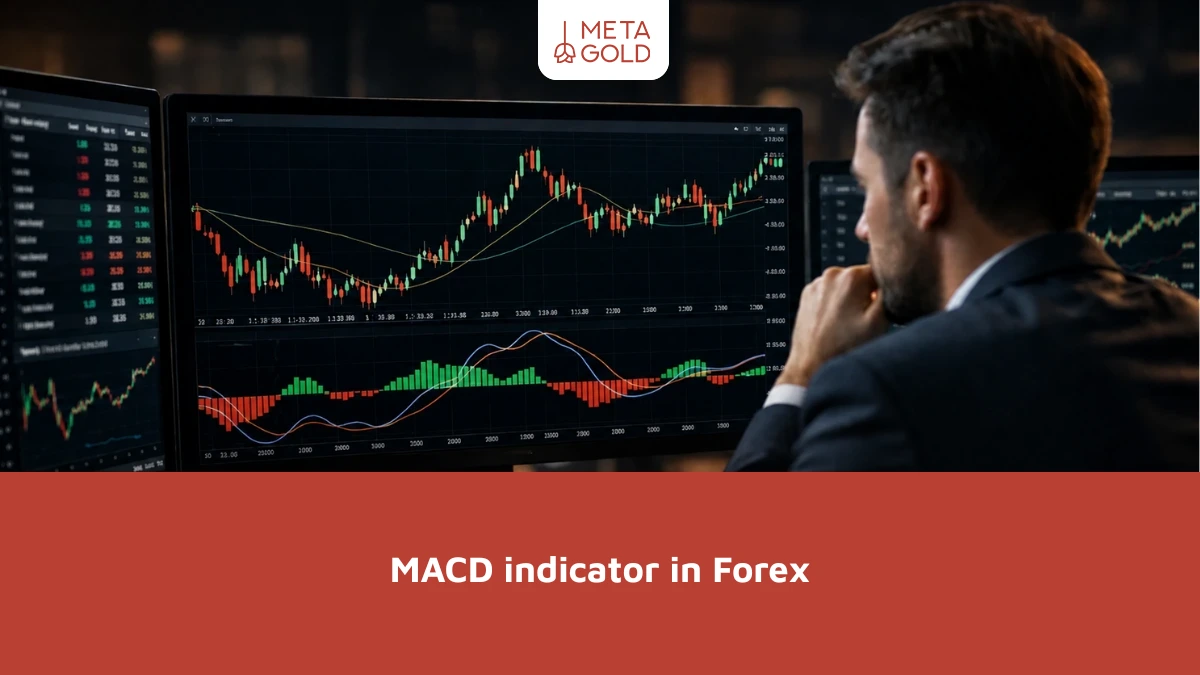
Many traders face a common challenge when using indicators: receiving a lot of signals but making poor decisions. The MACD strategy is one tool that, if understood and used correctly, can provide a clearer view of the market trend and momentum. In this article, we took a step-by-step look at

Mistaking a trendless market for the start of a new trend is a trap that leads to early entries and consecutive losses. By accurately identifying neutral ranges, the Range Market Detection Indicator helps you avoid risky trades and reserve your capital only for golden opportunities and major market waves. In

Detecting price reversals or breakouts in sensitive areas is a fine line between profit and loss, often accompanied by hesitation and hasty entries. The support and resistance indicator eliminates subjective analysis by automatically drawing key levels and improves your decisions at critical market moments. In this article, we will examine

The Forex market is one of the largest and most volatile financial markets in the world. Jumping into it without preparation is like swimming in a stormy ocean without a life jacket. This is why many new traders enter the market without adequate preparation and lose their capital. Opening a

When the market enters a volatile phase, entering a trade is more sensitive than ever; because a single candle can change the short-term direction of the movement and disrupt your scenario. For this reason, many traders turn to next candle prediction indicators ; tools that, by analyzing recent price behavior

Buying physical gold is still popular, but it’s not always the best option, as costs like fees, storage, and the difference in buying and selling prices can reduce returns. That’s why many people wonder what a gold investment fund is and whether it could be a more logical alternative. In

The size of each trade is reliable when it is determined based on the account risk and the stop-loss distance; otherwise, even the best strategies become unstable in the long run. The Position Size Calculator indicator performs these calculations quickly, standardly, and transparently. In this article, we will explain how

