When analyzing market price movements, you may notice that a trend suddenly gains strength or, conversely, stalls and reverses.
In such circumstances, the factor behind these changes is “momentum”; a force that can accelerate or dampen price movements.
In this article, we will explain what momentum is and how it is used in financial markets. We will also examinethe use of momentum in trading, particularly in stocks and forex, its role in identifying the strength or weakness of a trend, and its impact on trading decisions.
What Is Momentum? Definition and Meaning in Technical Analysis
To better understand what momentum is, we must first pay attention to the general meaning of the term. In financial markets, momentum refers to the speed and strength of price movement over a given period.
Simply put, momentum indicates how strongly the price of an asset is rising or falling and whether this movement is likely to continue or weaken.
In technical analysis, momentum is one of the most important indicators for examining market behavior. Traders use momentum analysis to determine whether the current market trend is strong enough or whether there are signs of weakening and a possible trend change. For this reason, momentum reflects the strength and velocity of price movements in financial markets.
Main applications of momentum in financial market analysis
- Assessing trend strength and the pace of price movement
- When momentum is high, it indicates greater power of buyers or sellers and the likelihood of a continuation of the trend.
- A decrease in momentum can be a warning of a decrease in trend strength and a possible halt or change in price direction.
- Use momentum indicators to more accurately analyze price movements and improve trading decisions.
What Is Momentum in the Stock Market?
In the stock market, momentum is the speed and strength of a stock’s price movement over a given period of time. Simply put, momentum indicates how strongly an asset’s price is rising or falling. The greater the price movement, the stronger the market momentum is said to be.
In general, momentum in the stock market helps traders better understand the following:
- Strength of the stock’s uptrend or downtrend
- The speed of price changes in the market
- The likelihood of the current trend continuing or weakening
- Identifying the right points to enter or exit a trade
The Importance of Momentum in Forex Trading
The Forex market is one of the most dynamic financial markets in the world due to its high trading volume, high liquidity, and 24-hour activity. In such a market, the concept of momentum becomes particularly important, as the prices of currency pairs often move very quickly in response to economic news, macro data, and capital flows.
Some of the most important differences between using momentum in Forex and in the stock market are:
- Very high liquidity: High trading volume allows momentum trends to form faster in major currency pairs.
- Rapid reaction to economic news: Data releases such as interest rates, inflation, or employment reports can create strong momentum in the market.
- 24-hour market activity: In Forex, momentum may change across different trading sessions (Asia, Europe, or America).
- Widespread use of short-term strategies : Many day traders and scalpers use momentum to enter trades quickly.
Common Strategies for Using Momentum in Forex
Forex traders typically use a few common methods to use momentum:
Trend Trading Strategy
One of the most common ways to use momentum in the forex market is through a trend-following strategy. In this strategy, the trader attempts to enter a trade when the market is in a certain trend and strong momentum indicates that the price movement is likely to continue.
Typically, when the price of a currency pair is continuously recording higher highs and lows in an uptrend or lower highs and lows in a downtrend, we can say that a clear trend has formed in the market. If in such a situation, momentum indicators also confirm the strength of the price movement, the probability of the trend continuing increases.
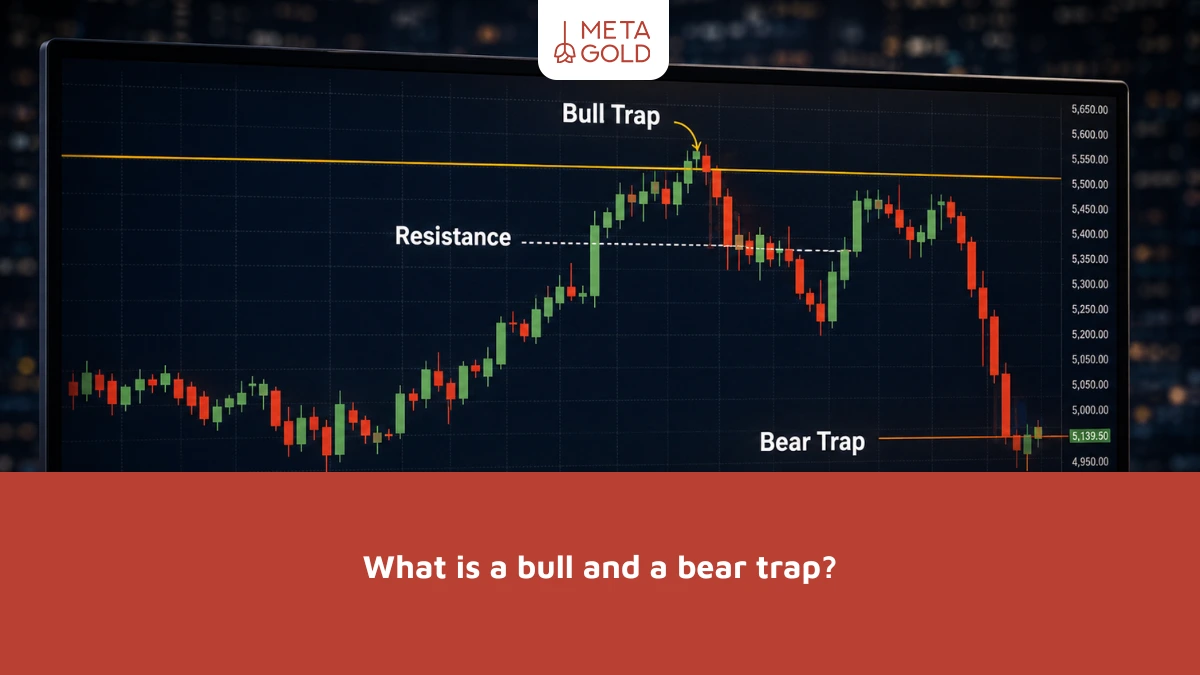
Strategy for using breakout levels
Another important application of momentum in forex trading is the support and resistance breakout strategy. In this method, traders wait for the price to break through a significant level on the chart with force.
When a price breaks through a resistance level with high momentum, it usually indicates increased demand and new buyers entering the market. In such a situation, a new uptrend is likely to form.
Conversely, if the price breaks a key support level with speed and high volume, it could be a sign of sellers gaining strength and the start of a downtrend. Traders usually enter a trade in this situation after confirming the breakout.
Momentum Divergence Strategy
Momentum divergence occurs when price action and momentum indicators behave differently. This is often seen as a sign that the current market trend is weakening. For this reason, many traders use momentum divergence to identify potential market reversal points.
Combining Momentum with Other Indicators
To increase the accuracy of the analysis, traders often use momentum alongside technical analysis indicators. These tools help the trader better assess the true strength of the price movement.
Some of the most commonly used momentum indicators include:
- RSI (Relative Strength Index): identifies trend strength and overbought or oversold conditions
- MACD: To identify momentum changes and entry and exit signals
- Stochastic: To check the speed of price movement and possible reversal points
How to use momentum in day trading?
To use momentum in day trading, traders typically employ a few common methods:
- Identifying high-momentum assets : Traders look for stocks or currency pairs that have high volatility and trading volume throughout the day. These assets are more prone to creating rapid price movements.
- Entering a trade at the beginning of a strong move : When the price quickly crosses an important level or a strong trend is forming, traders try to enter a trade at the early stages of the move to profit from the continuation of the trend.
- Using Momentum Indicators: Tools like RSI, MACD, Momentum, and Stochastic help traders better analyze the strength of price movement and receive appropriate signals to enter or exit a trade.
- Pay attention to trading volume: In many cases, increasing momentum is associated with increasing trading volume. If a price move occurs with high volume, it is usually more credible.
Differences in the Application of Momentum in Different Markets
The concept of momentum is the same in all financial markets, but the way it is formed and applied in the stock market, forex, and crypto is different due to differences in liquidity, trading hours, and the level of market volatility.
| Market | Momentum Characteristics | How It Is Used in Trading |
|---|---|---|
| Stocks | Slower momentum formation and stronger influence from company-specific news | Identifying medium-term trends and suitable entry points in stocks |
| Forex | Faster momentum formation due to high liquidity and sensitivity to economic news | Short-term trading and identifying breakout opportunities |
| Crypto | Very high volatility and rapid momentum shifts | Identifying fast-moving trends and short-term trading opportunities |
The Role of Momentum in Determining the Strength or Weakness of a Market Trend
Momentum in technical analysis indicates how strong a price trend is and whether it is likely to continue. In essence, this concept measures the speed of price movement and helps traders better understand the state of the market trend.
When momentum is strong, it indicates that the current trend has enough strength to continue. However, if momentum decreases, it can be a sign that the trend is weakening and a possible correction or change in price direction is possible.
Traders usually identify the strength or weakness of a market trend by examining the increase or decrease in momentum, as well as the divergence between price and momentum indicators.
Types of Momentum Indicators
In technical analysis, various indicators are used to measure momentum, or the speed of price movement. Below are some of the most important momentum indicators.
RSI indicator
The Relative Strength Index (RSI) is one of the most popular momentum indicators that measures the strength of upward and downward price movements. The value of this indicator fluctuates between 0 and 100.
Typically, when the RSI reaches above 70, the market is overbought and the possibility of a price correction increases. Conversely, an RSI below 30 can indicate oversold and the possibility of a price reversal.
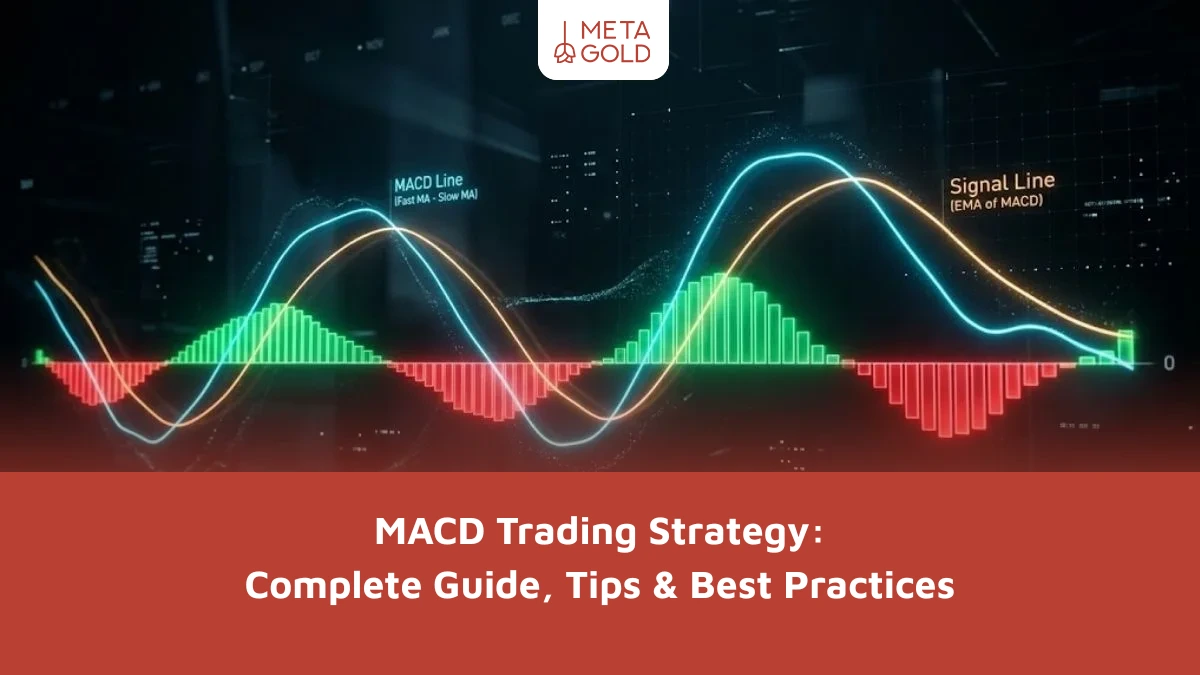
MACD indicator
The MACD indicator is another important tool for momentum analysis. It is made up of a combination of moving averages and helps traders identify changes in trend strength.
When the MACD line crosses the signal line upwards, it is usually considered a bullish signal. Conversely, when the MACD line crosses downwards, it can be a sign of weakening trend and possible price declines.
Stochastic indicator
The Stochastic Oscillator measures the speed of price movement relative to a price range over a specified period of time. Like the RSI, it is used to identify overbought and oversold conditions.
If the Stochastic value is above 80, the market may be overbought. Conversely, if it is below 20, it could be an indication of oversold and a possible price reversal.
Momentum indicator
The momentum indicator is one of the simplest tools for measuring the speed of price changes. It looks at the difference between the current price and the price over a period of time.
An increase in the value of this indicator indicates that the strength of the price movement is increasing, while a decrease can be a sign of a weakening market trend.
Momentum Summary
In answer to the question of what momentum is, momentum is a concept in technical analysis that shows the speed and strength of price movement in the market and helps traders assess the strength of a trend. By examining momentum, it is possible to determine whether a trend is likely to continue or whether there are signs of weakness and a change in direction.
This concept is applied to various markets such as stock markets, forex, and cryptocurrencies, and is usually analyzed using indicators such as RSI, MACD, Stochastic, and Momentum to enable traders to make more accurate and informed trading decisions.
Momentum Frequently Asked Questions
1. What is momentum in trading?
Momentum in trading refers to the speed and strength of price movement in one direction, which helps traders identify strong market trends and determine the right time to enter or exit a trade.
2. What is momentum in the stock market?
Momentum in the stock market indicates the strength of a stock’s price movement in an upward or downward trend and is usually used to identify medium-term trends and appropriate buying or selling opportunities.
3. How does momentum work in Forex?
In the forex market, momentum indicates the speed of price changes in currency pairs, and traders use it to identify trend strength, break important levels, and take short-term trades.
4. What are the differences in the application of momentum in different markets?
The application of momentum in different markets depends on factors such as liquidity, volatility, and market structure; for example, trends are usually slower in the stock market and faster in Forex and Crypto.