
In financial markets, one of the most common reasons traders lose money is by entering moves that seem very obvious and logical on the surface, but are actually “deceptive moves.” Many people enter a trade after a support or resistance break, only to find out later that they have fallen into a bull trap or a bear trap. These traps create false breakouts, encouraging traders to enter on impulse and then move in the opposite direction.
In this article, we’ll examine exactly how bull traps and bear traps are formed, how to identify them, and most importantly, how to avoid getting caught in them.
What is a bull trap and how is it formed?
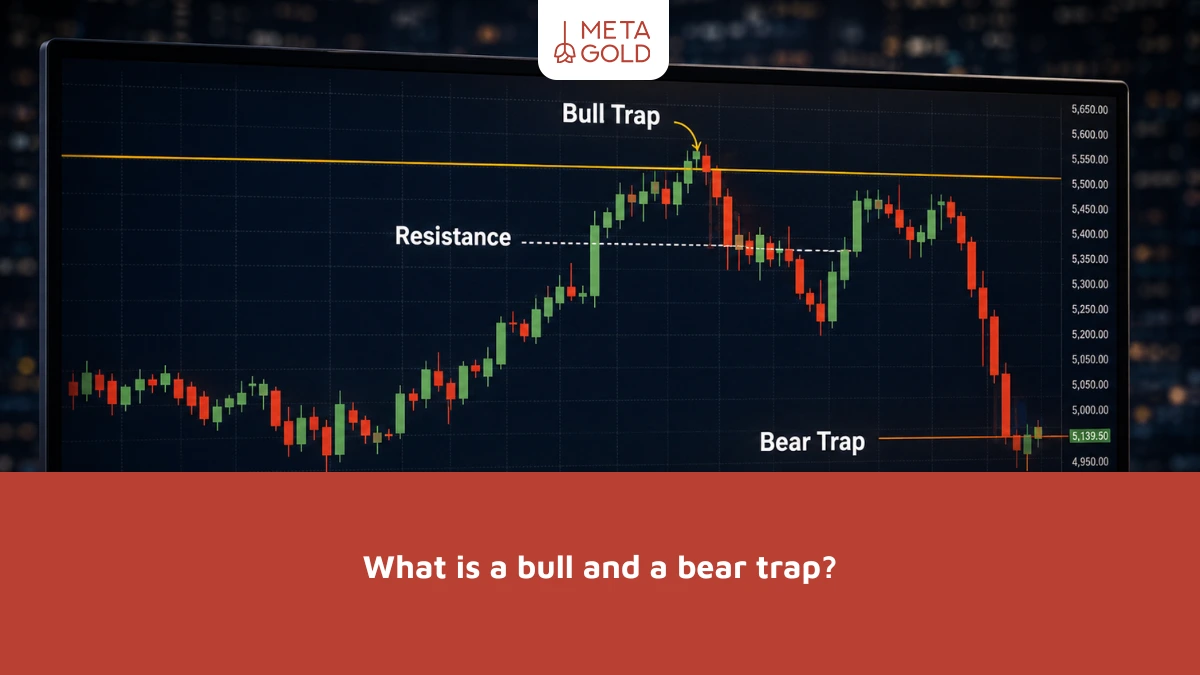
What is a bull trap? In simple terms, a bull trap is a false bullish signal. This means that the price moves as if the downtrend is over and the market is ready to grow, for example by breaking through a resistance level, but this movement is not sustainable and the price soon returns to the downtrend.
Bull traps are essentially false upside breakouts that trick buyers into entering a trade before the market quickly reverses lower. Bull traps are usually most effective when a combination of the following conditions occur:
- Rapid changes in market sentiment
- Herd mentality
- The role of resistance levels
To give you a more complete picture, if you see somewhere that they say what a bull trap is, they usually mean a bull trap or a “false bullish breakout” that ultimately ends up hurting buyers.
We recommend that you refer to the article on this topic to understand what a bear and bull market are .
What is a bear trap and why does it deceive traders?
What is a bear trap? By basic definition, it is when an asset or index appears to be falling and traders enter a sell or short position expecting the price to continue falling, but the price suddenly reverses and rises. In technical analysis, a bear trap usually occurs as follows:
- The price appears to be breaking below an important support level.
- Traders conclude that the downtrend will continue and enter into selling/shorting.
- But the price quickly rebounds and rises unexpectedly.
- Sellers get caught and are forced to buy at a higher price to close out their short position; this can increase buying pressure.
How does a bull trap occur in cryptocurrency?
Traps can occur in any asset market, including cryptocurrencies and other markets with unpredictable dynamics. Therefore, traps can also form in the crypto market, especially in the following situations:
- High Volatility : When movements are rapid and unpredictable.
- Less liquidity : which makes price changes more sudden.
- Oversold conditions that can create the basis for a sudden reversal.
- A rapid change in market sentiment or unexpected positive news that reverses the direction of the movement.
From this perspective, a bull trap in cryptocurrency is usually seen when, in a bearish or volatile environment, the market shows a short and seemingly “valid” uptrend, attracting buyers.
Signs of identifying a bull trap and a bear trap
No single tool or signal can confirm the presence of a trap with certainty. Below, we will examine the most important signs.
1) Quick reversal after breaking the key level
One of the most obvious warnings is a rapid price rebound after breaking an important level.
- In a bear trap, the price breaks below the support level, giving the impression that a downtrend is beginning or intensifying, but then quickly bounces back above the same level.
- In a bull trap, the price breaks through resistance and signals a bullish move, but quickly falls back below resistance.
These sudden reversals show that the initial breakout or breakdown lacked strength and follow-through.
2) Failure to confirm the movement by trading volume (Volume)
Trading volume is one of the most important tools for distinguishing valid breakouts from false breakouts.
- If the price breaks below support but there is no significant increase in volume, it indicates that sellers do not have enough strength and conviction to continue the move. This could be a sign of a bear trap.
- Conversely, if a bearish breakout is followed by a sudden, significant jump in volume as the price rebounds, the likelihood of a trap forming increases.
3) The market is in the oversold zone.
Indicators such as the RSI or Stochastic Oscillator can show that the market has moved too far in the bearish direction. When an asset enters the oversold zone, the probability of a technical reversal increases. If an apparent bearish breakout occurs under the same conditions, the risk of a bear trap increases because the market is technically ready to reverse.
4) Reversal candlestick patterns
Some candlestick patterns can signal a change in direction, especially if they appear after a sharp decline. Notable examples include:
- Hammer
- Bullish Engulfing
The appearance of these patterns after a bearish breakout can indicate that selling pressure is weakening and a reversal is possible. This alerts the trader to the possibility of a bear trap.
5) Identifying bear traps on Point & Figure charts
On Point & Figure charts, which focus only on price action and ignore time and volume, the bear trap pattern has a distinct structure.
In these diagrams:
- O columns indicate price declines.
- X columns indicate price increases.
A bear trap is formed when:
- Several O columns advance to near previous lows;
- An O-column breaks only one box below the previous lows;
- Then an X column immediately forms and the price moves back up.
If the bearish breakout goes more than one box lower, the structure is no longer considered a bear trap in the Point & Figure framework.
How to avoid getting caught in a bear and bull trap?
If you learn to wait a little and get confirmation, you can bypass a large portion of these traps. There are a few simple but vital principles that will reduce the likelihood of falling into a bear or bull trap, which we have examined below.
Get confirmation from the market before each entry.
Many times the problem is not the analysis itself, but the rush to execute. The market often makes seemingly obvious breakouts that are convincing at first glance, but then reverses direction a few candles later.
- A break of a key level is not enough on its own. Check whether trading volume really supports the move; valid breakouts are usually accompanied by a noticeable increase in volume.
- Examine the price action. Is the movement consistent with the overall trend structure or against it?
- Take a look at the indicators. Tools like the RSI or MACD, if they are in extreme areas, may warn that the market is ready to reverse.
- If you are using Fibonacci or moving averages, see if multiple tools are giving the same message at the same time or if you are only seeing a single signal.
Don’t ignore the broader market context
Sometimes the chart shows a breakout, but the market sentiment says otherwise. Sudden news, a change in analyst tone, or even a wave of emotion on social media can quickly change direction. If the market has become too negative, a small positive piece of news can surprise sellers. Conversely, if everyone is too bullish, the slightest selling pressure can catch buyers off guard.
Mistakes that lead you straight into the trap
Many market traps occur not because of the complexity of the analysis, but because of a few simple behavioral errors. When decisions are made based on excitement, haste, or overconfidence in a signal, the likelihood of getting caught up in deceptive moves increases.
- Entering a trade just because a level breaks, without checking volume and other confirmations
- Ignoring overall market conditions and relevant news
- Chasing the price after much of the move has been made
- Not setting a specific stop-loss
- Staying in the trade solely in the hope of a reversal
Real-life examples of bull and bear traps in financial markets
In January 2021, many believed GameStop stock was headed for a sell-off, and a large volume of short selling ensued. Then, a sudden buying spree, partly coordinated by retail investors on social media sites like Reddit, sent the price soaring, with sellers taking heavy losses. One of the key lessons the text highlights is this: Even when you are certain that the decline will continue, you need to have exit and risk management tools.
In another example, an ETF (Advisor Shares Pure Cannabis ETF, symbol YOLO) showed a bearish engulfing pattern after a long downtrend, but then the price unexpectedly jumped, showing that previous signals can be misleading and trap sellers.
Conclusion
If you know what a bull trap is and what a bear trap is, you can wait for confirmation from volume, price structure, and reversal signals instead of reacting emotionally. Using tools like RSI, MACD, and looking at the overall market conditions will reduce the chances of getting caught in false breakouts. The most important principle is this: get confirmation and stop loss before every entry.
FAQ
1) What is a bull trap and why is it dangerous?
A bull trap occurs when the price breaks through resistance but the breakout is not sustained and the market turns bearish again. Buyers who entered hoping for the start of an uptrend are left with a losing position.
2) What is a bear trap and when does it form?
A bear trap occurs when the price drops below support but quickly recovers and rises. Sellers who were expecting the decline to continue are forced to exit the trade at higher prices.
3) How to recognize a bull trap in cryptocurrency?
Checking trading volume, the speed of the reversal, and whether the market is volatile or overbought can help identify warning signs. Breakouts without volume confirmation are usually suspicious.
4) Does every break of support or resistance mean the start of a new trend?
No. Many breakouts can be temporary and false. Confirmation with volume and other technical tools is essential.
5) What should we do if we get caught in a trap?
The most important thing to do is stick to your stop loss and exit without delay. Hoping for a market reversal usually makes the loss bigger.