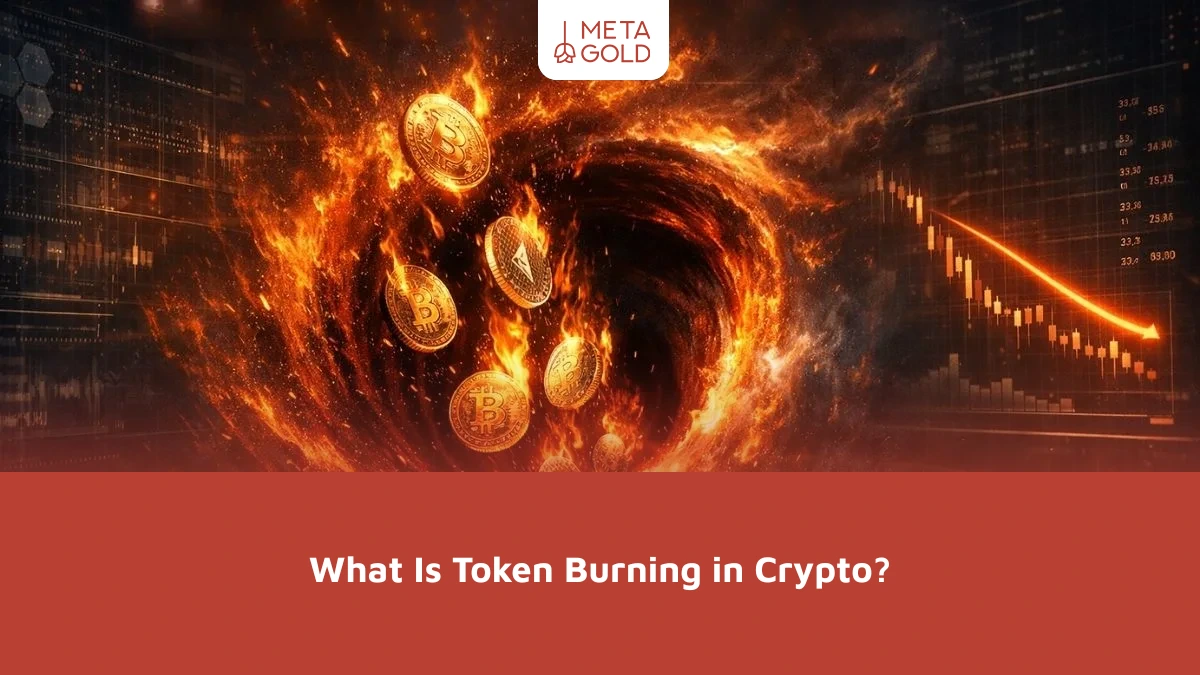
What is token burning in cryptocurrency? And why do projects permanently remove part of their assets? Many users assume that any decrease in supply means a definite increase in price, while the relationship between supply, demand, and value is much more complex than this simple perception. In this article, we
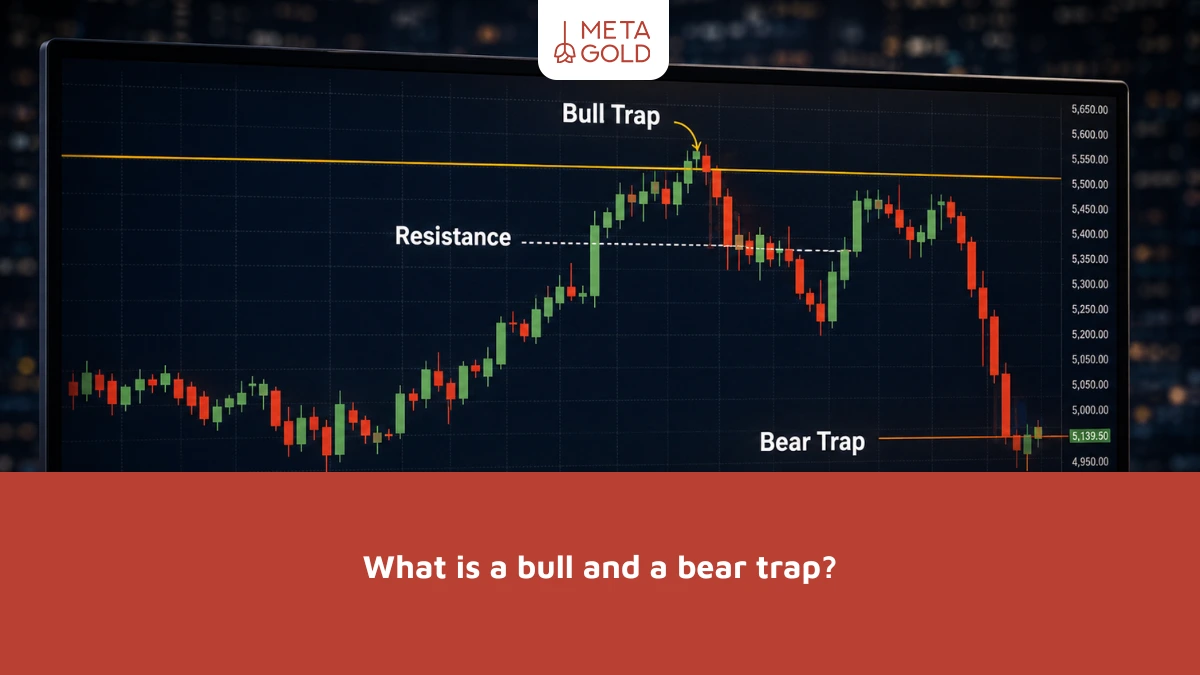
In financial markets, one of the most common reasons traders lose money is by entering moves that seem very obvious and logical on the surface, but are actually “deceptive moves.” Many people enter a trade after a support or resistance break, only to find out later that they have fallen
If you plan to trade global indices, you’ve probably wondered what the Dow Jones symbol is in Forex. And how is it different from stock trading? Many traders know that the Dow Jones is one of the most important U.S. stock market indices, but they may not fully understand its
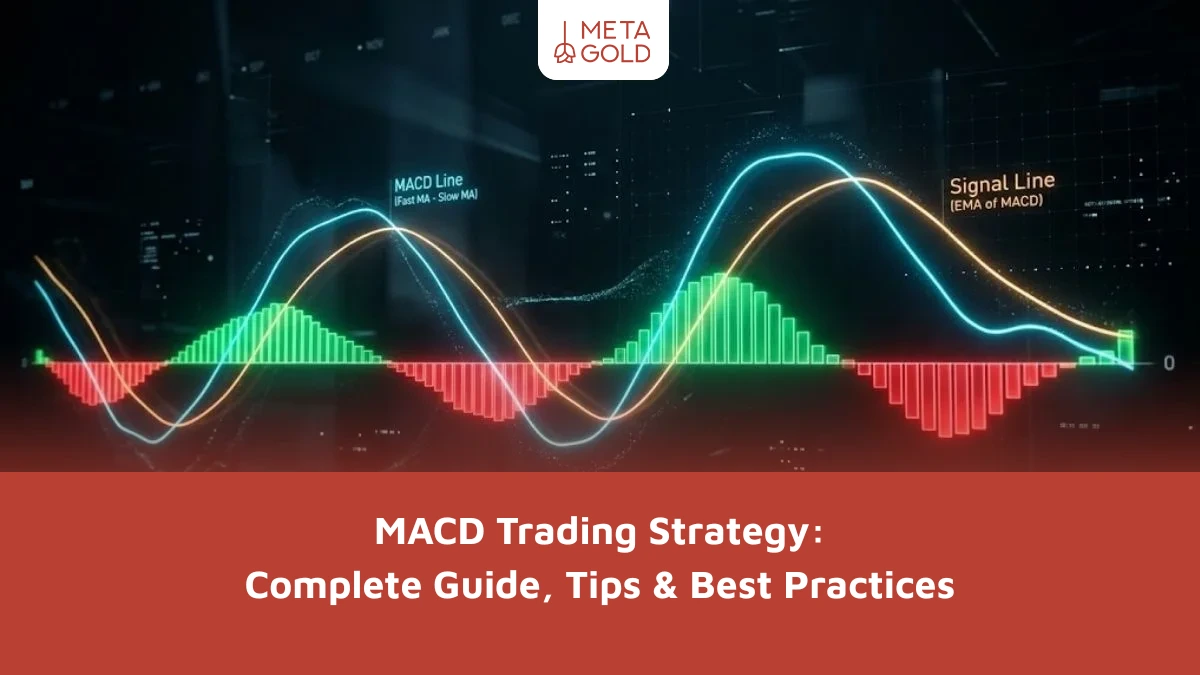
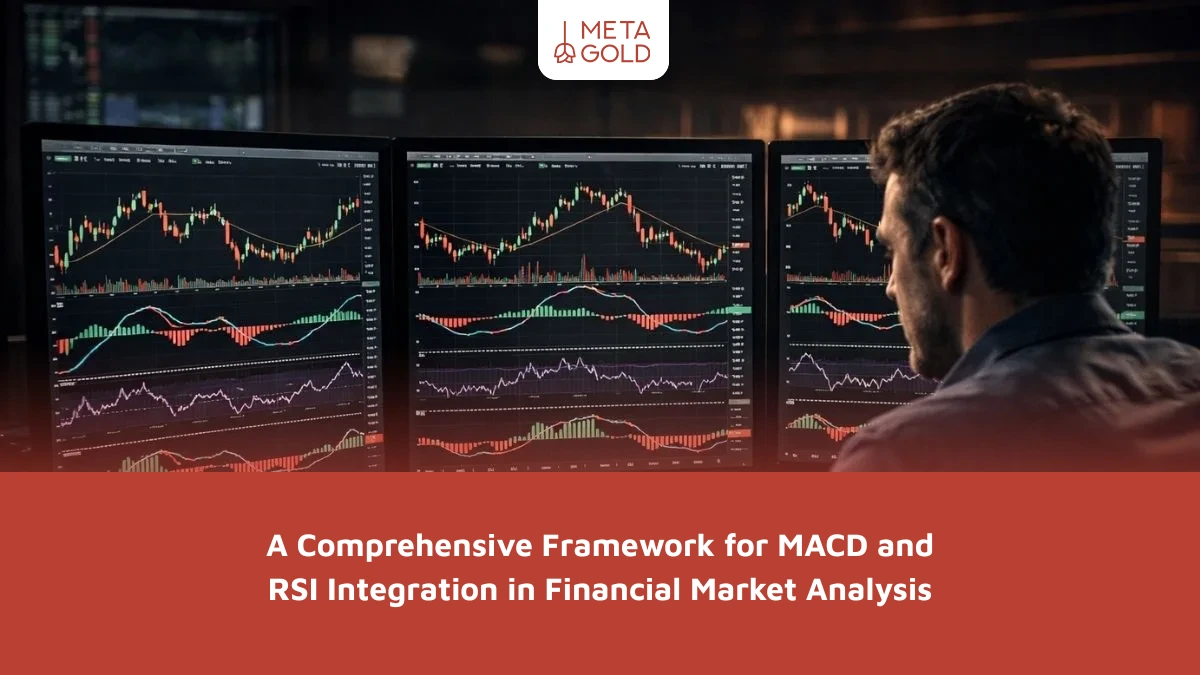
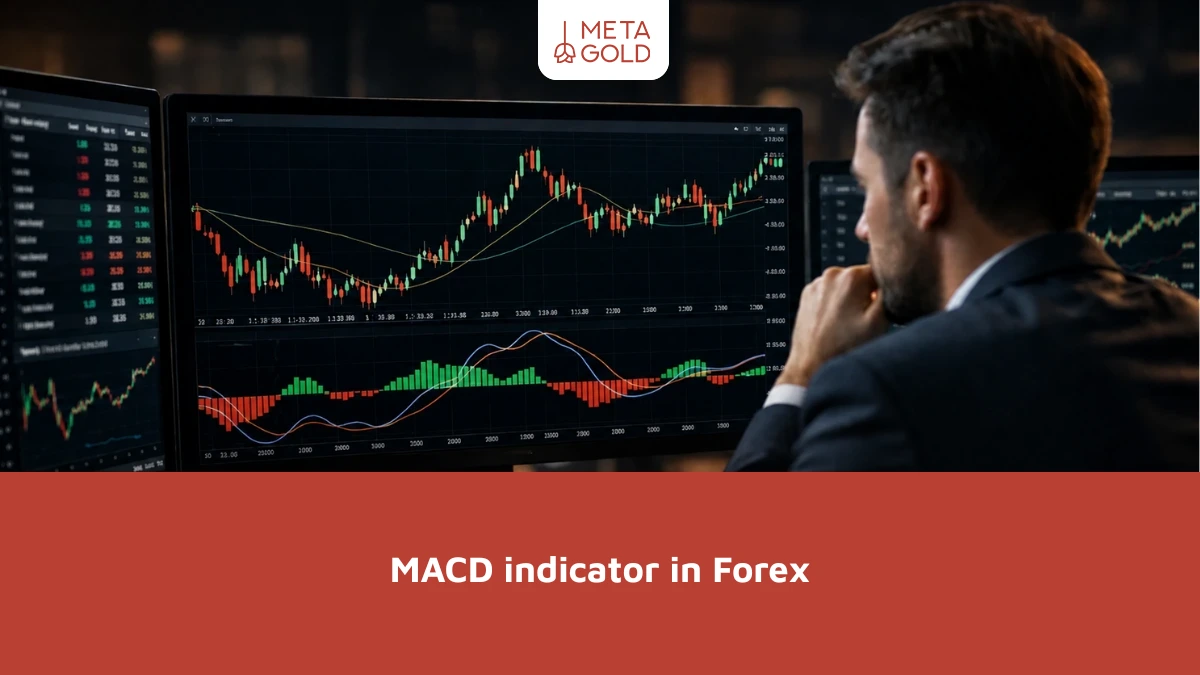
Many traders face a common challenge when using indicators: receiving a lot of signals but making poor decisions. The MACD strategy is one tool that, if understood and used correctly, can provide a clearer view of the market trend and momentum. In this article, we took a step-by-step look at
Understanding CFD trading can be difficult for beginners and even intermediate traders, especially when leverage, margin, and forex come into play. Many people assume that by purchasing a CFD they are owning an asset, when in reality the nature of this instrument is completely different. If you are wondering how
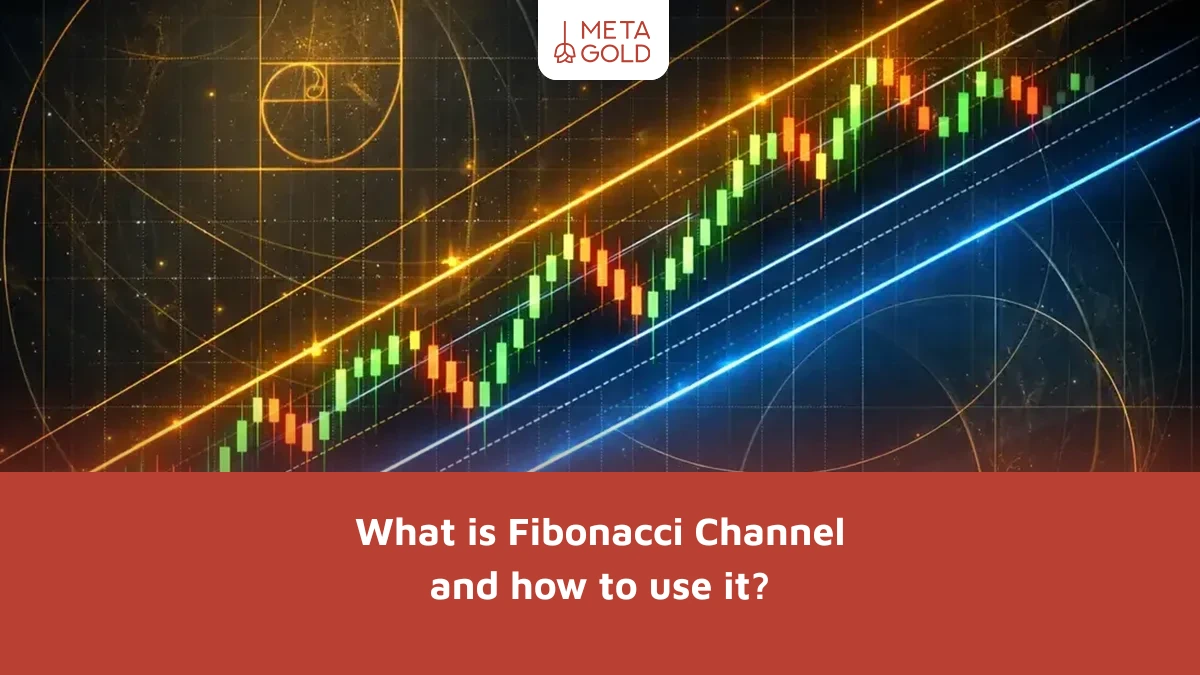
Imagine you are looking at a price chart; the market is constantly moving up and down, and finding important areas to enter or exit a trade is not an easy task. In such situations, technical analysis tools can act as a roadmap. One such useful tool is the Fibonacci channel;
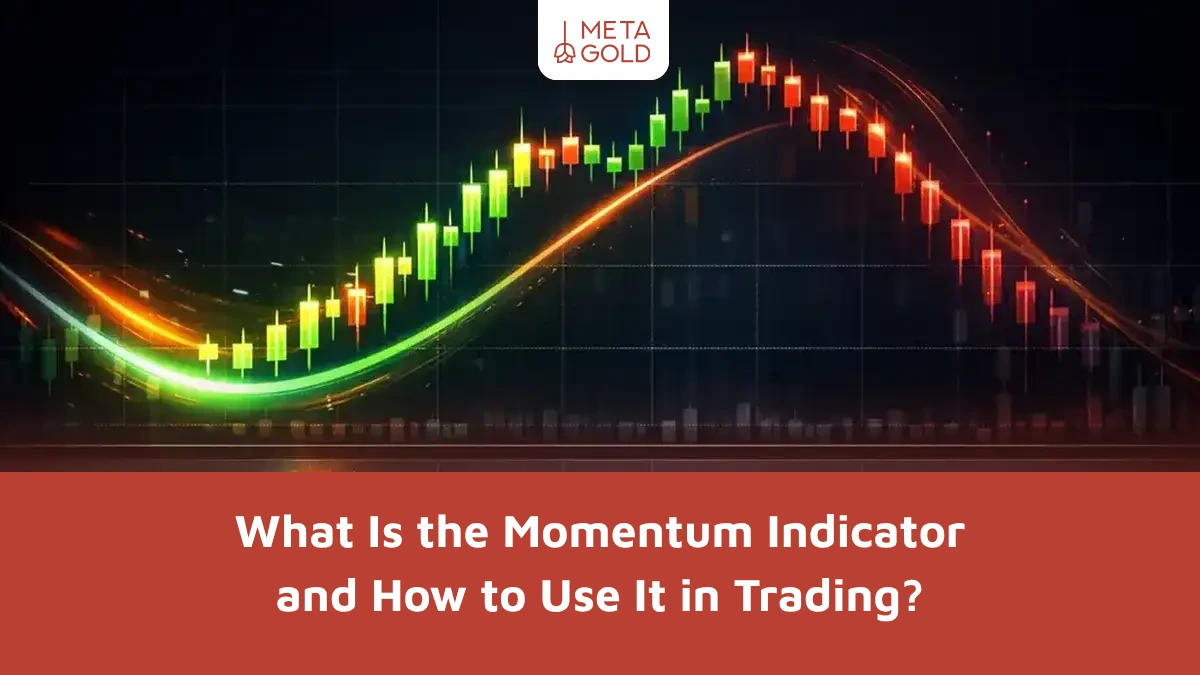
Imagine you have opened a chart and the price is moving rapidly, but one key question comes to mind: will this strong move continue or is it just a short-term fluctuation? In such a situation, tools that can show the momentum and strength of the price movement play a very
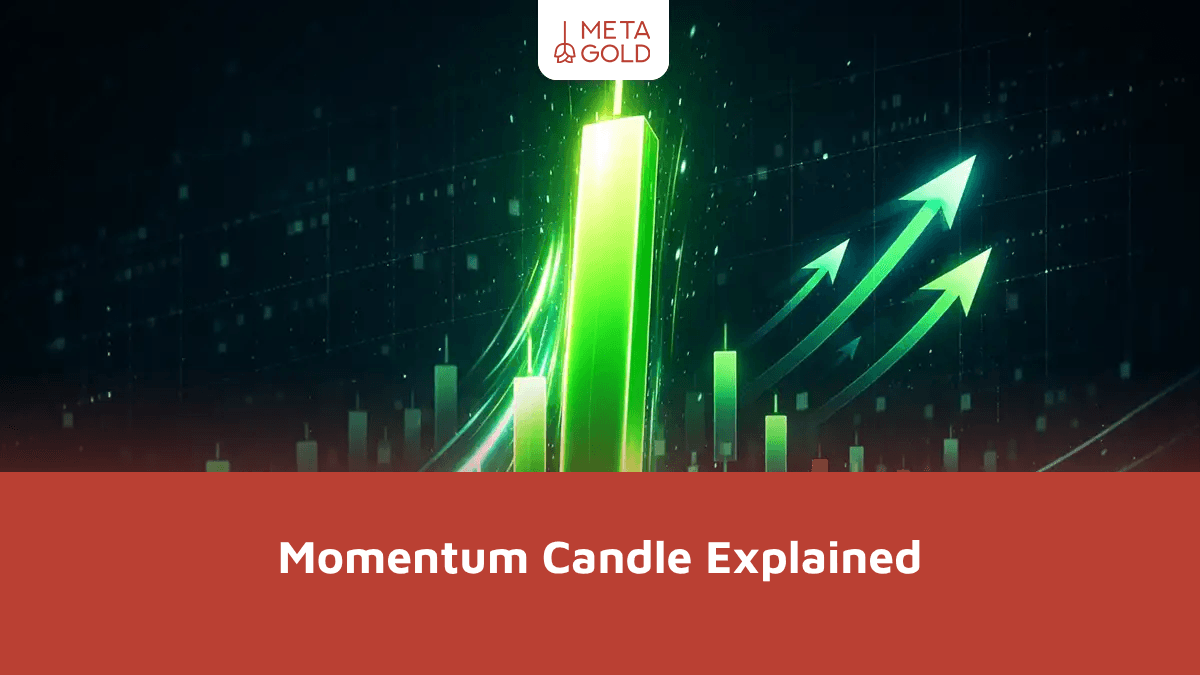
In financial markets, sometimes a candle appears on the chart that is different from the others; it has a larger body and indicates that buyers or sellers have entered the market with strength. In technical analysis, traders often refer to this type of candle as a momentum candle; a candle

When analyzing market price movements, you may notice that a trend suddenly gains strength or, conversely, stalls and reverses. In such circumstances, the factor behind these changes is “momentum”; a force that can accelerate or dampen price movements. In this article, we will explain what momentum is and how it
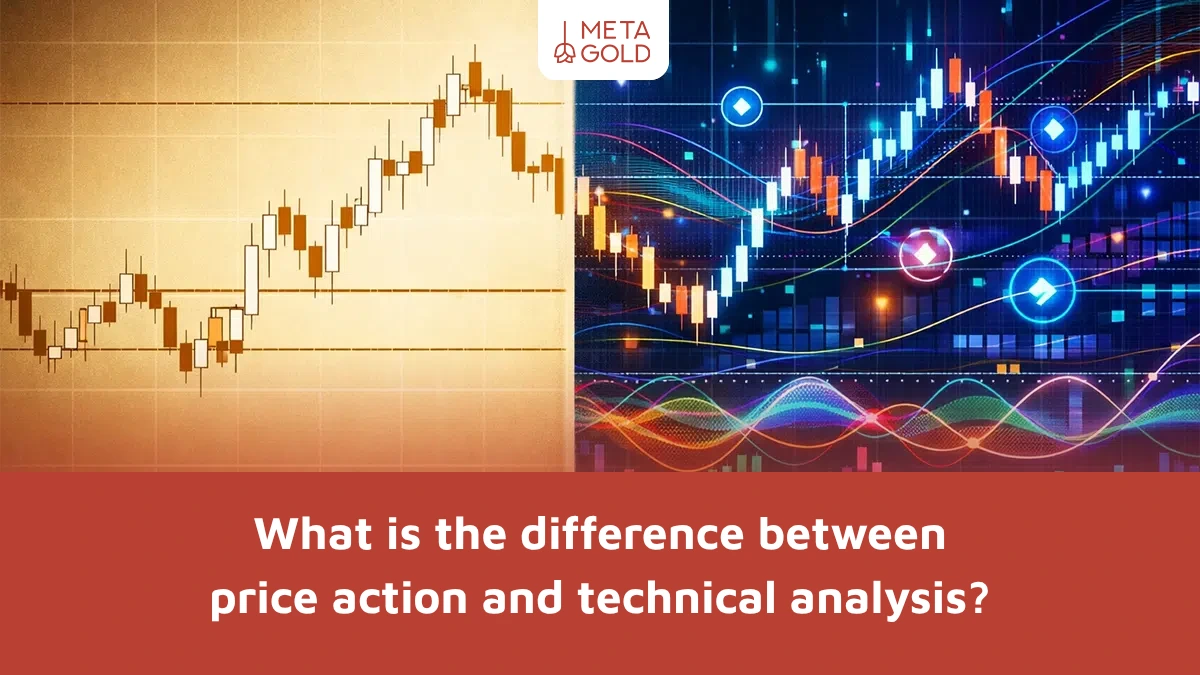
If you are new to trading, you have probably started looking for ways to analyze the market. As you learn, you will likely come across two common terms: price action and technical analysis. But soon you will wonder: what is the difference between these two approaches? In reality, many traders

