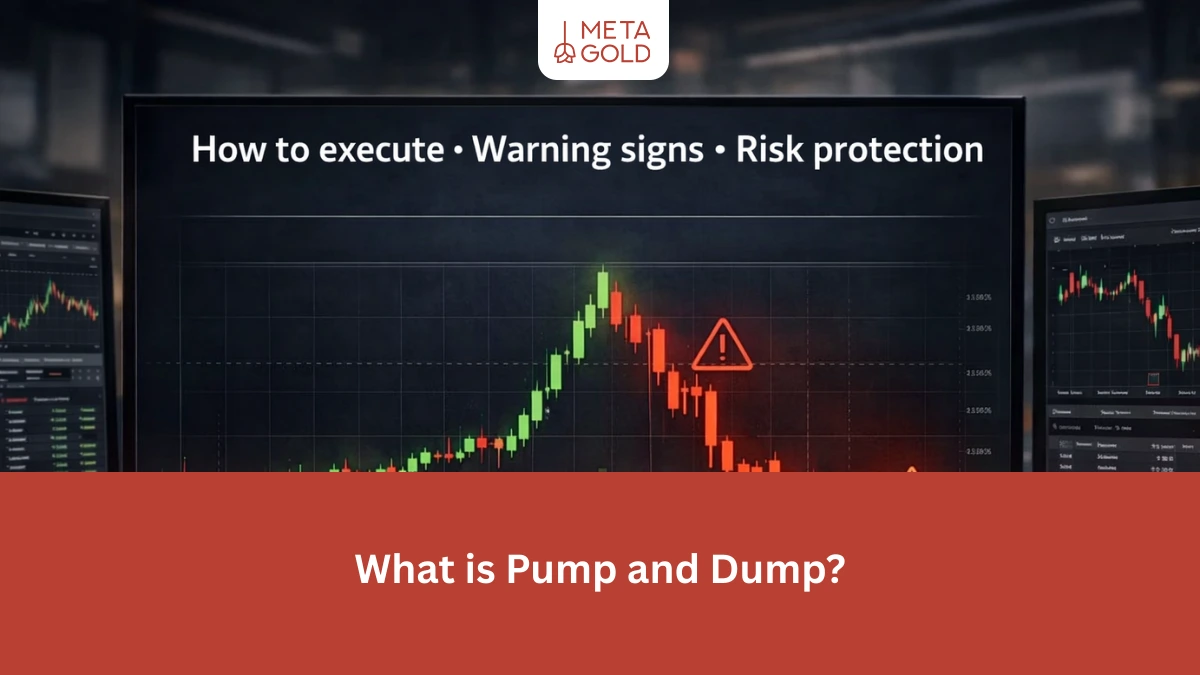
The cryptocurrency market is known for its extreme volatility and sudden growth, but there isn’t always real progress behind these price spikes. One of the riskiest and most controversial behaviors in the market is cryptocurrency pump and dump, a pattern in which the price of a token is artificially inflated
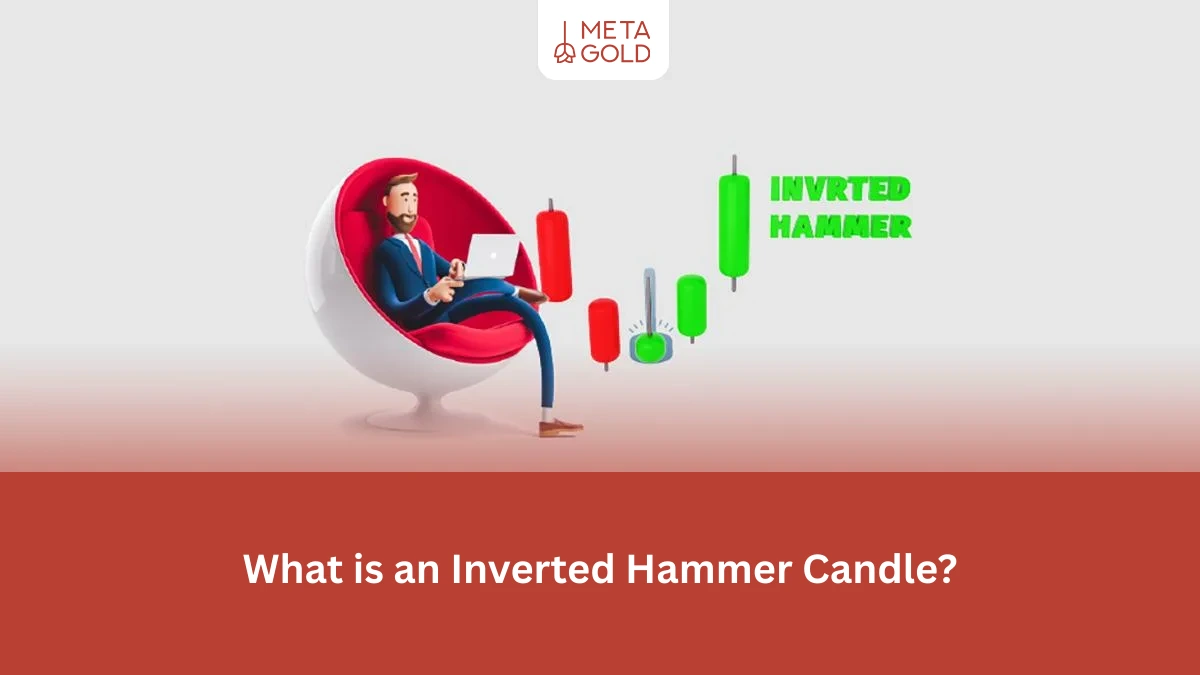
If you are looking for an early signal to detect the end of a downtrend, the inverted hammer candle It can be one of the most important patterns to recognize. This reversal pattern appears in technical analysis with a long upper shadow and a small body, signaling the entry of
In today’s financial markets, understanding the different trading styles is a crucial step to success. Among the most common styles, spot and futures trading have attracted the attention of many traders due to their different structures and functions. But what exactly is the difference between spot and futures? Are these
If you are looking for the symbol for platinum in Forex or want to find its chart on TradingView, the common symbol for this metal in the financial markets is XPTUSD, which is the price of one ounce of platinum in US dollars. But platinum is not just a “precious
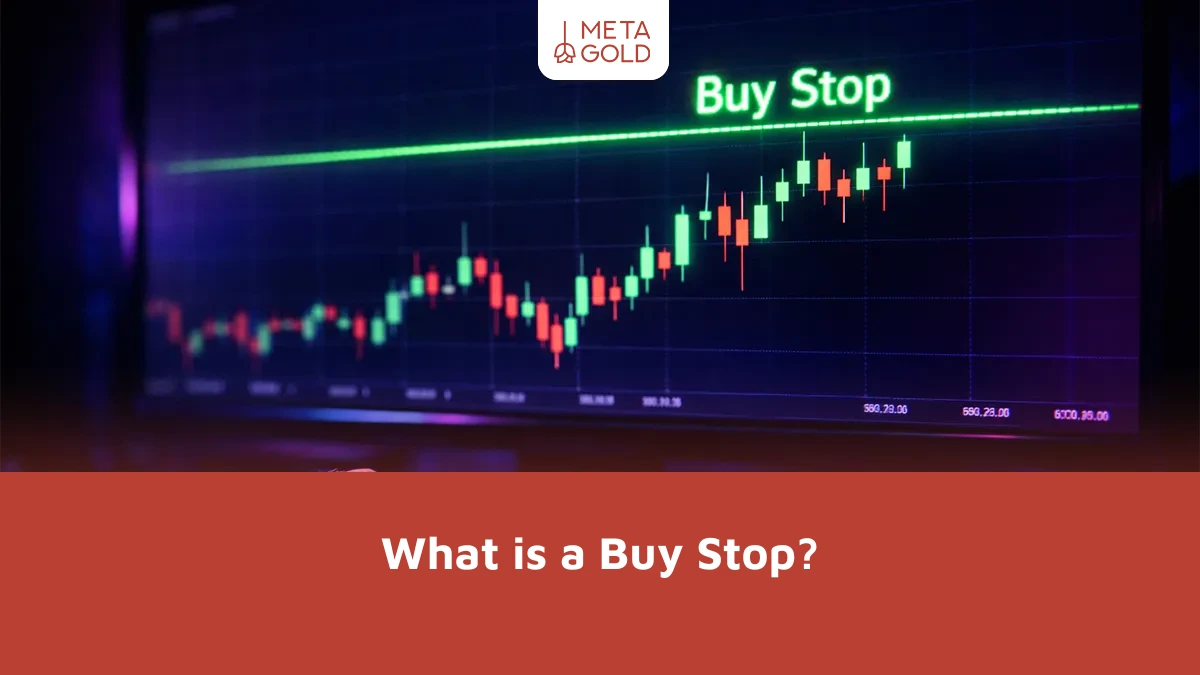
If you are a Forex or Crypto trader, you have probably been waiting for a price ceiling to break, but at the exact moment the price took off, you were not in the system and missed the opportunity. Pending Orders are designed to manage exactly such situations. One of the
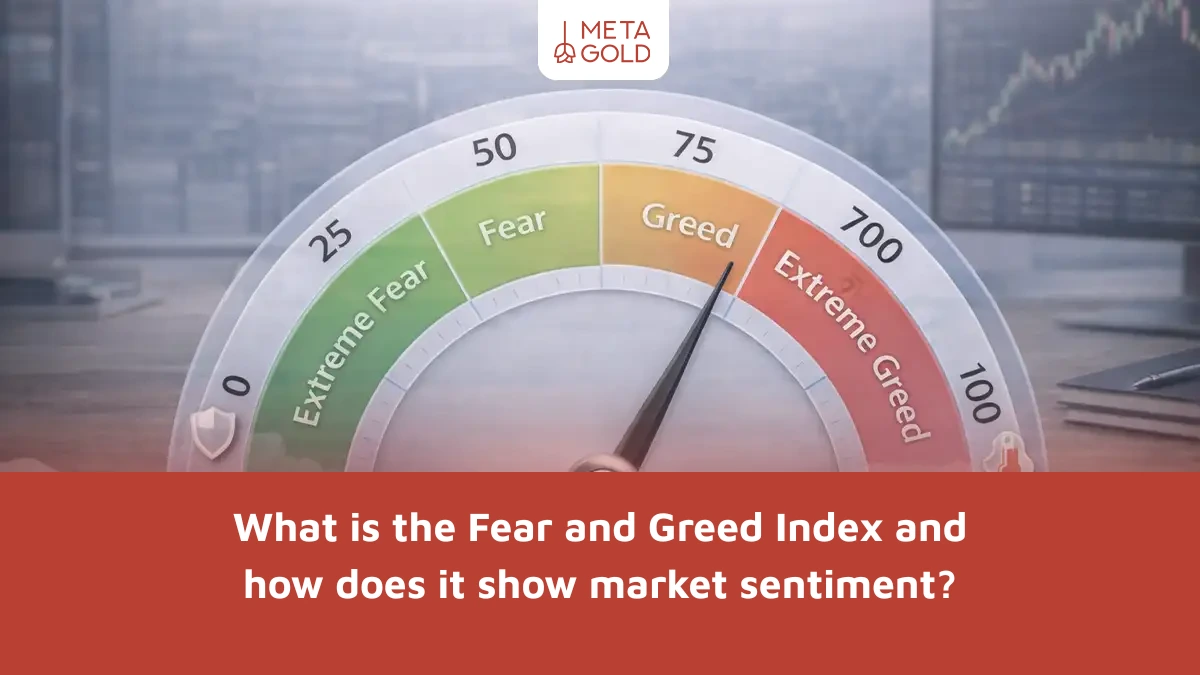
If you’ve Googled “What is the Fear and Greed Index,” you’re probably looking for a quick and actionable answer: This index is a number (0 to 100) that indicates the market’s fear or greed atmosphere. It means traders are becoming more cautious or making more emotional decisions. But here’s the
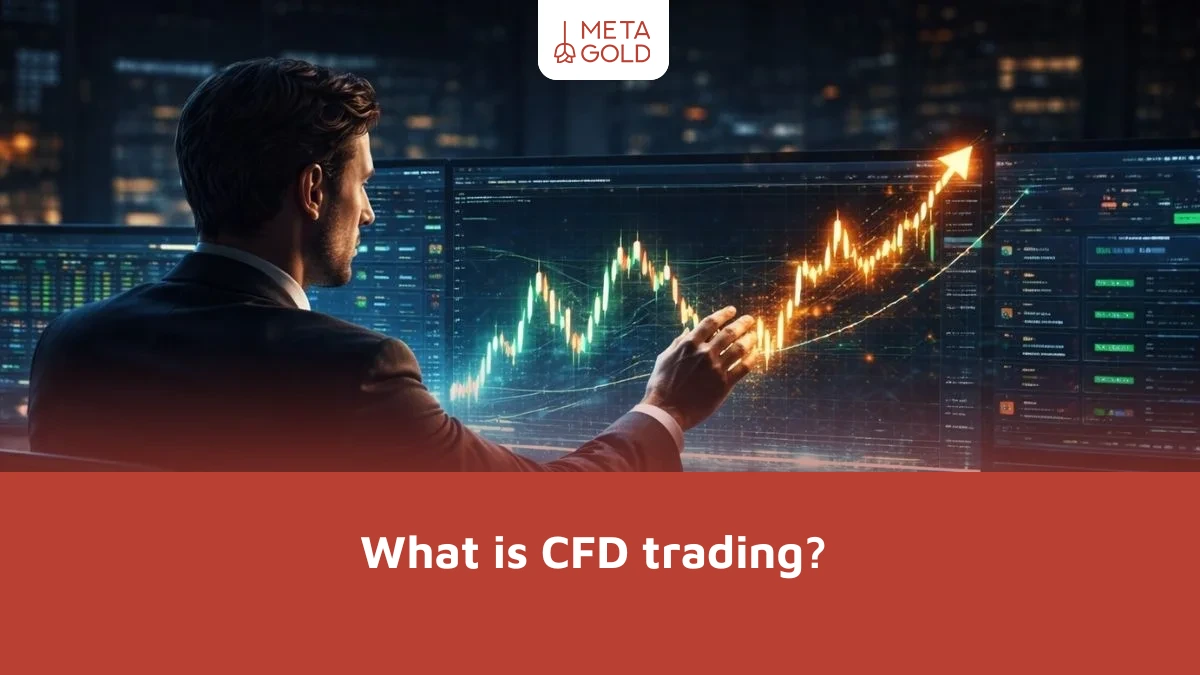
Understanding CFD trading can be difficult for beginners and even intermediate traders, especially when leverage, margin, and forex come into play. Many people assume that by purchasing a CFD they are owning an asset, when in reality the nature of this instrument is completely different. If you are wondering how
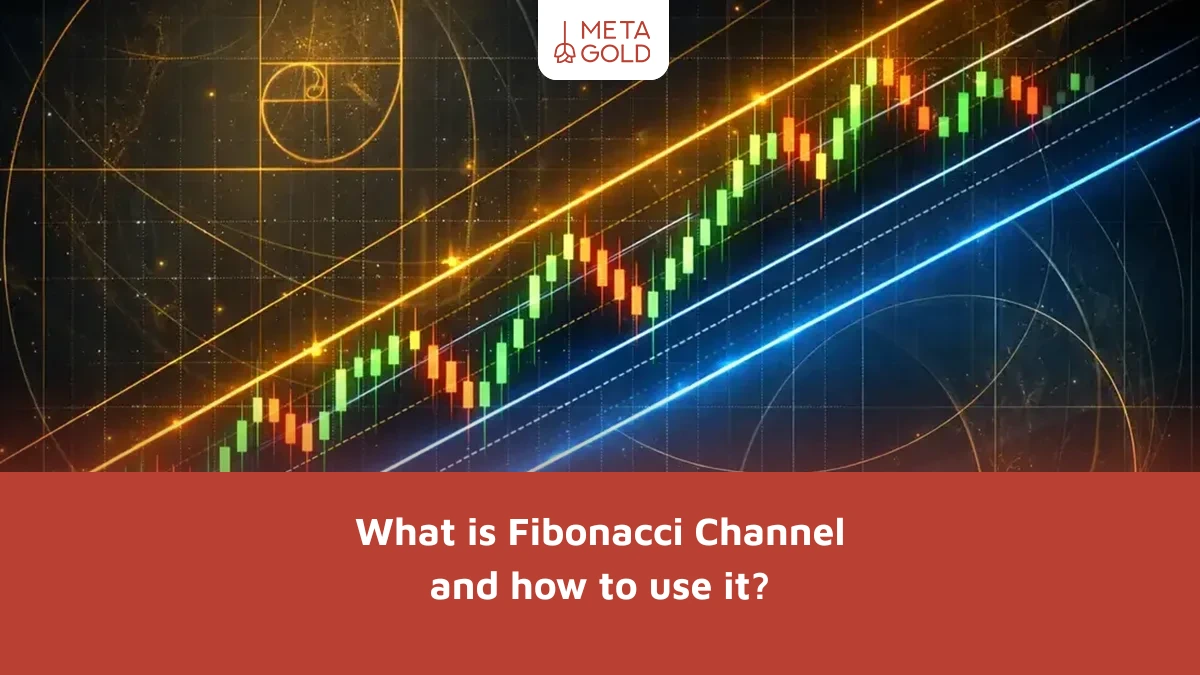
Imagine you are looking at a price chart; the market is constantly moving up and down, and finding important areas to enter or exit a trade is not an easy task. In such situations, technical analysis tools can act as a roadmap. One such useful tool is the Fibonacci channel;
Imagine you have opened a chart and the price is moving rapidly, but one key question comes to mind: will this strong move continue or is it just a short-term fluctuation? In such a situation, tools that can show the momentum and strength of the price movement play a very
In financial markets, sometimes a candle appears on the chart that is different from the others; it has a larger body and indicates that buyers or sellers have entered the market with strength. In technical analysis, traders often refer to this type of candle as a momentum candle; a candle

When analyzing market price movements, you may notice that a trend suddenly gains strength or, conversely, stalls and reverses. In such circumstances, the factor behind these changes is “momentum”; a force that can accelerate or dampen price movements. In this article, we will explain what momentum is and how it
If you are new to trading, you have probably started looking for ways to analyze the market. As you learn, you will likely come across two common terms: price action and technical analysis. But soon you will wonder: what is the difference between these two approaches? In reality, many traders

