


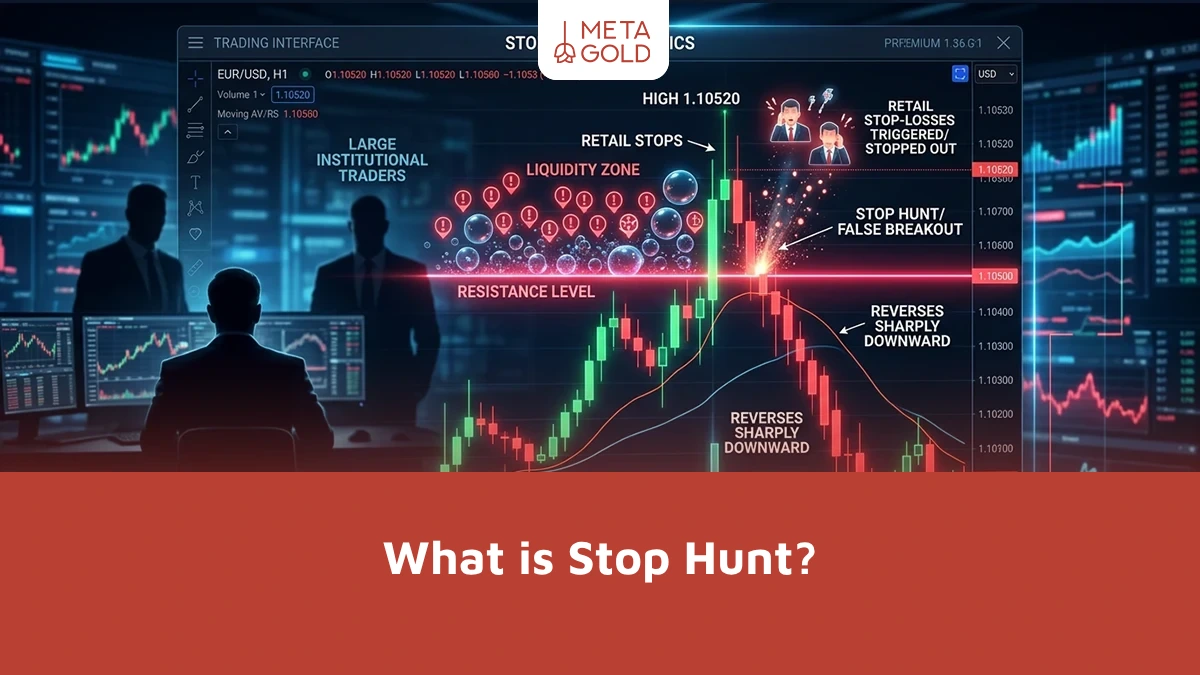
In financial markets, sometimes the price briefly breaks a support or resistance level just before a strong move begins, triggering many traders’ stop-loss orders, but then immediately resumes its original path. This market behavior is called stop hunting. Stop hunting occurs when price moves into an area with a large

The cryptocurrency market is not limited to buying and selling on exchanges. In addition to regular trading, there are other ways to trade, one of the most important of which is the OTC market. In this type of market, transactions are carried out outside the general order book of exchanges,
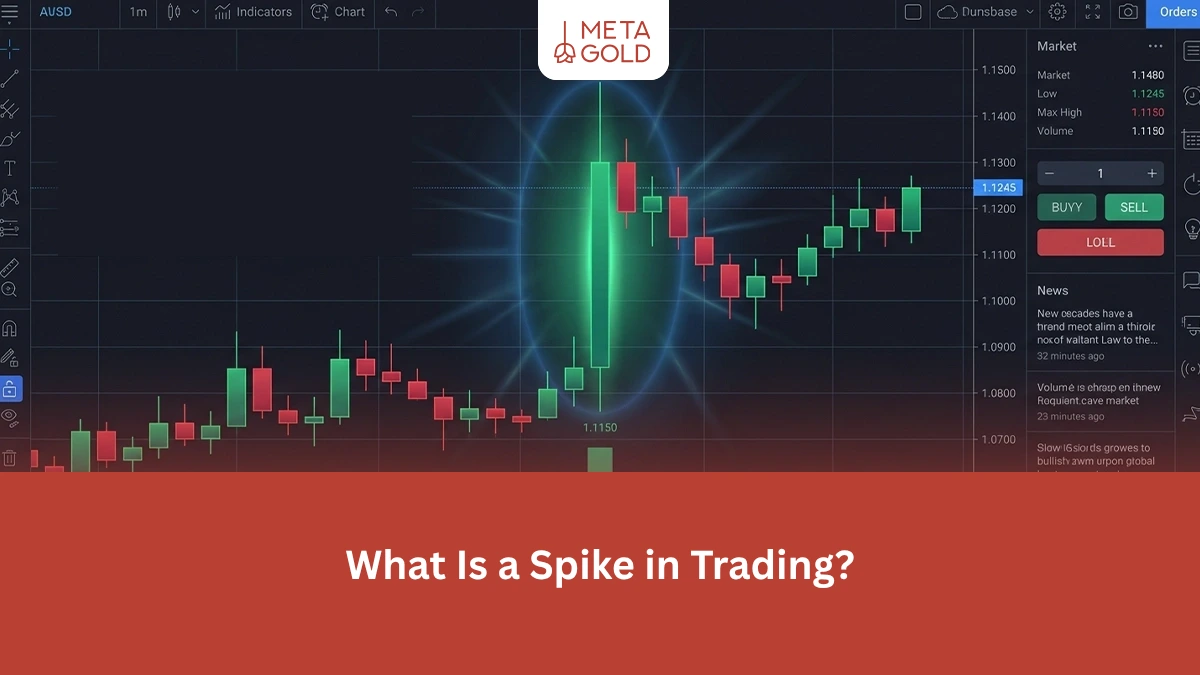
In financial markets, prices sometimes move sharply higher or lower within a very short period of time. This type of rapid jump usually appears in the form of a very large candle or long wick on the chart and attracts the attention of traders. This sudden movement in the market

Choosing between the Forex and Cryptocurrency markets is one of the main challenges for people who are planning to enter the world of trading or investing. Both markets provide the opportunity to earn money, but they have fundamental differences in terms of structure, risk level, price volatility and trading methods.
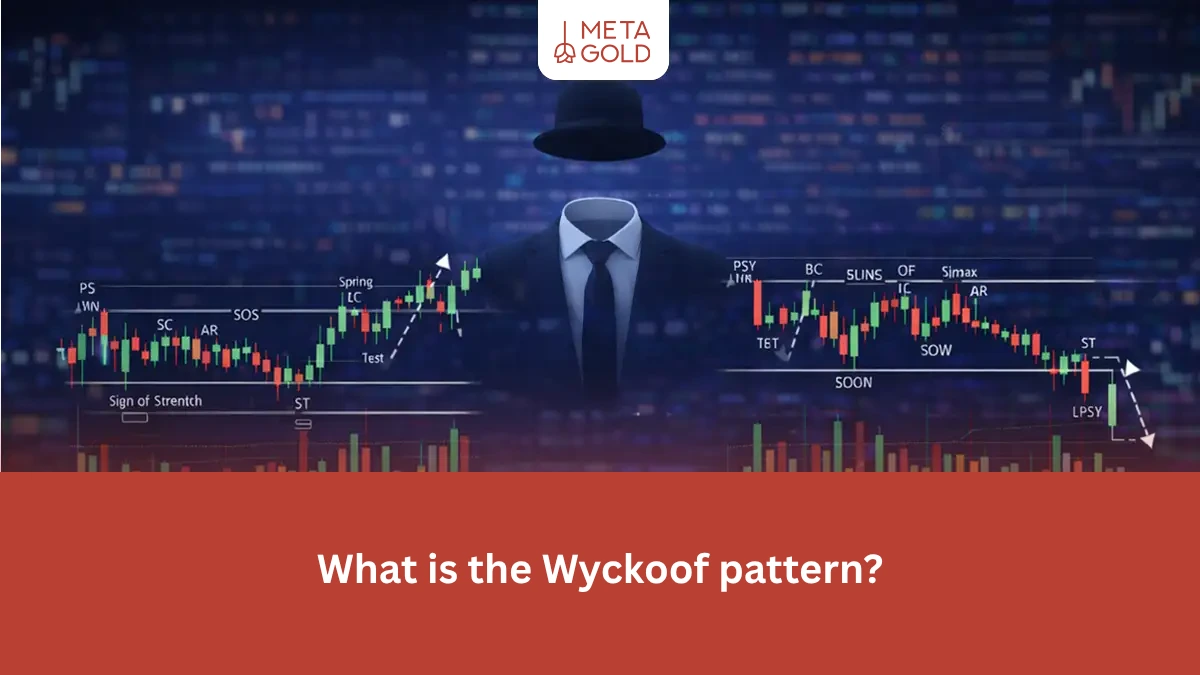
If you are wondering what the Wyckoff Method is, the short answer is: Wyckoff is a behavioral framework for chart reading that helps you understand what stage of its cycle the market is in—accumulation, growth, distribution, or decline—and why price is reacting within ranges. In this Wyckoff method tutorial, concepts
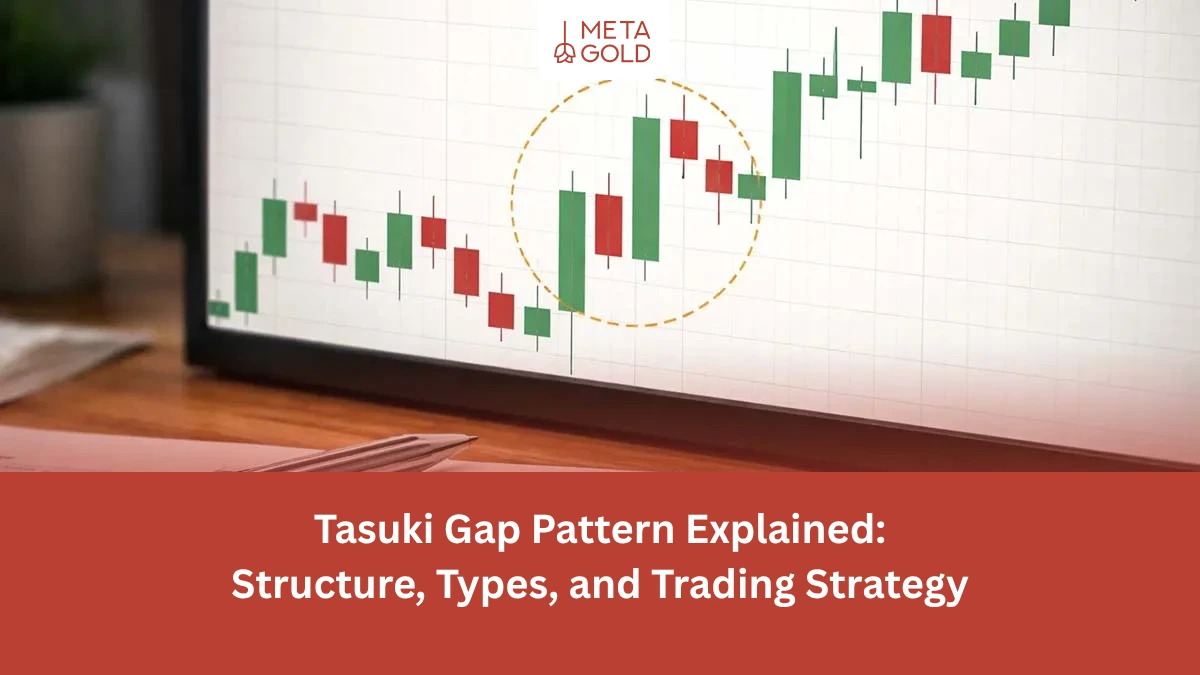
Traders often wonder whether a recent correction signals the end of a strong move or is merely a temporary pause. The Tasuki Gap Pattern in technical analysis was developed to help answer this question. By combining a price gap and an incomplete correction, this pattern can provide a clue about

What is token burning in cryptocurrency? And why do projects permanently remove part of their assets? Many users assume that any decrease in supply means a definite increase in price, while the relationship between supply, demand, and value is much more complex than this simple perception. In this article, we
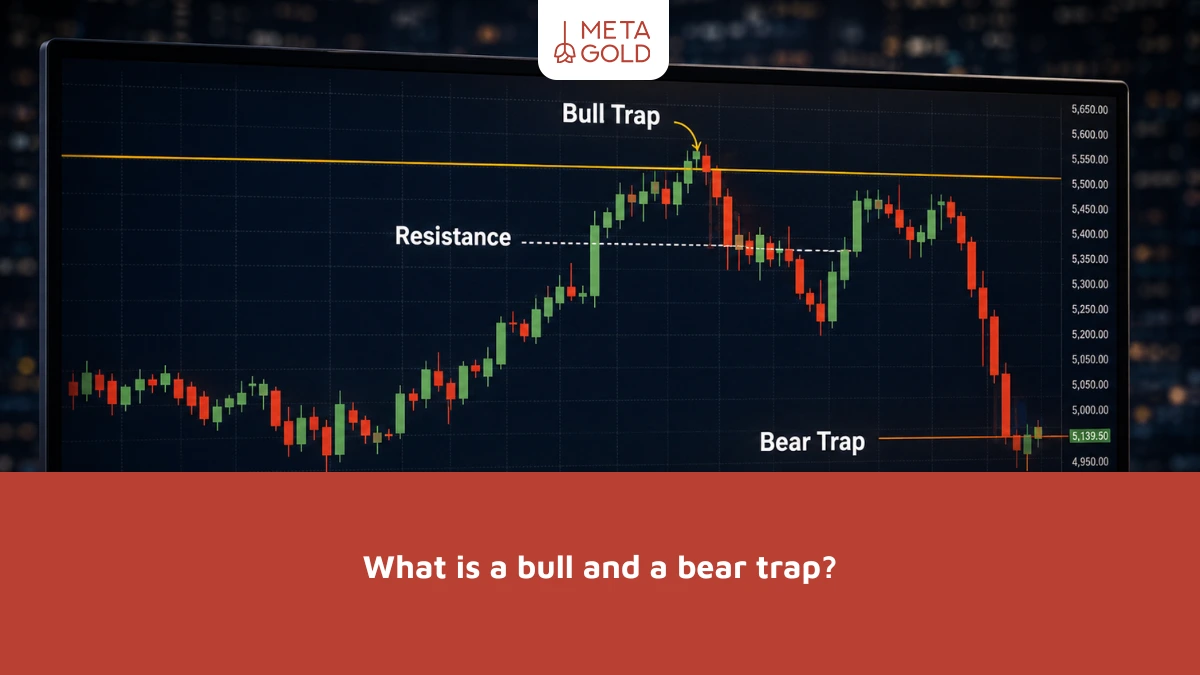
In financial markets, one of the most common reasons traders lose money is by entering moves that seem very obvious and logical on the surface, but are actually “deceptive moves.” Many people enter a trade after a support or resistance break, only to find out later that they have fallen
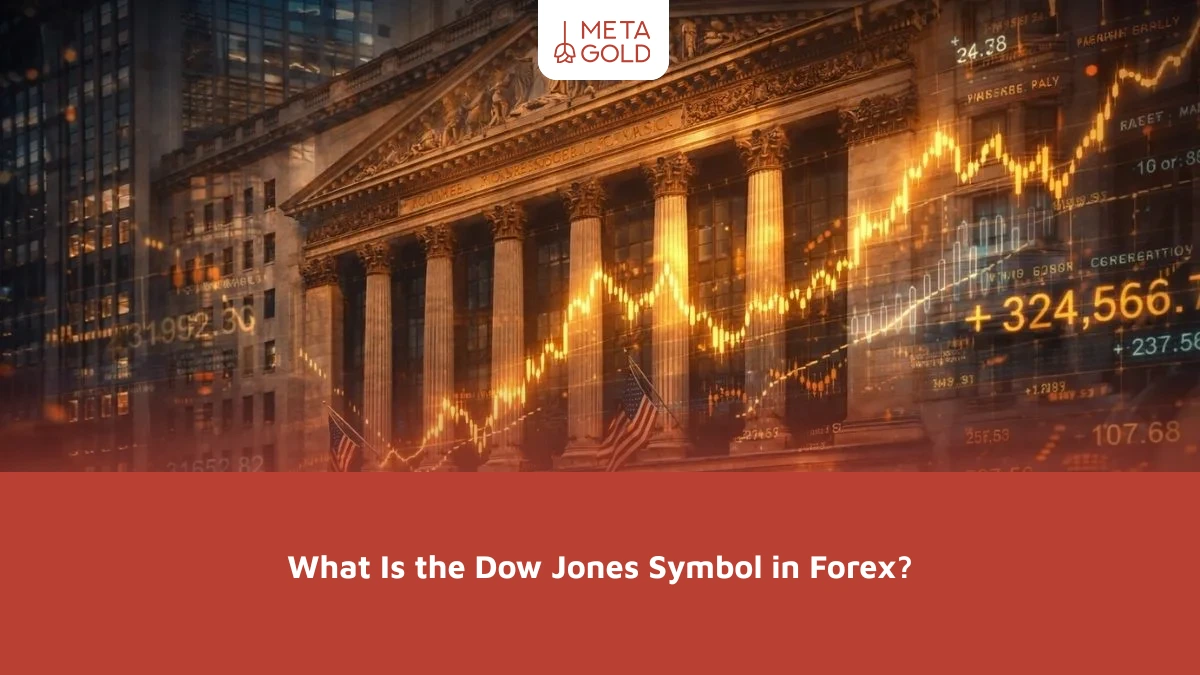
If you plan to trade global indices, you’ve probably wondered what the Dow Jones symbol is in Forex. And how is it different from stock trading? Many traders know that the Dow Jones is one of the most important U.S. stock market indices, but they may not fully understand its
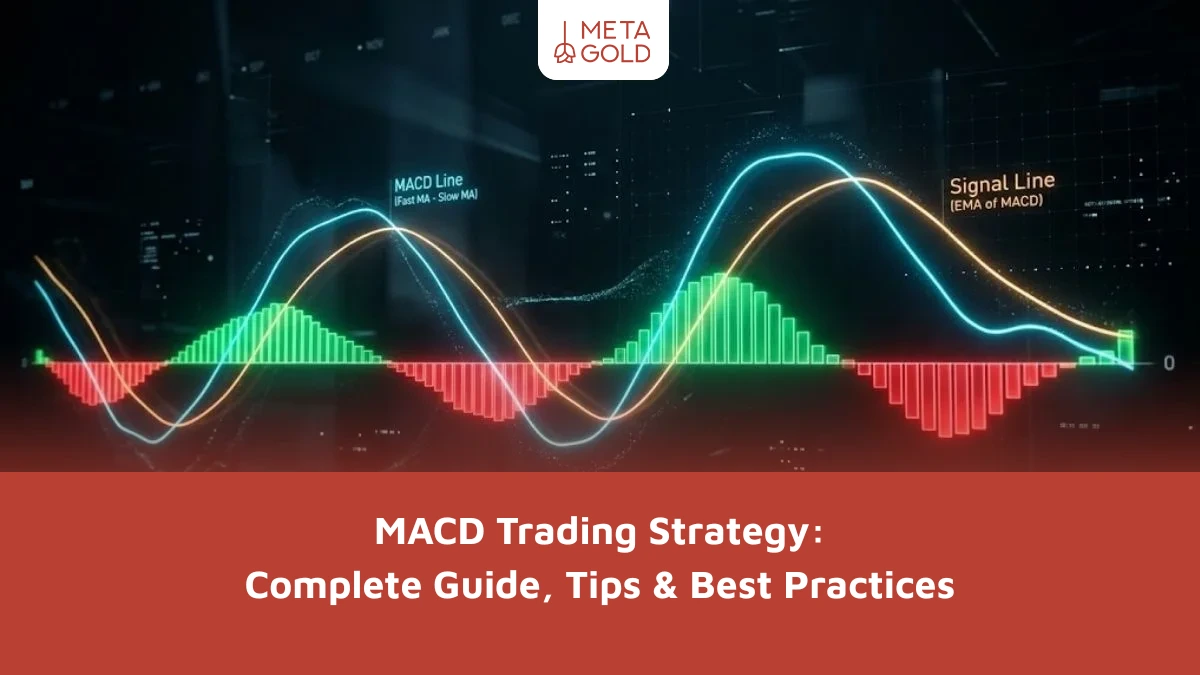
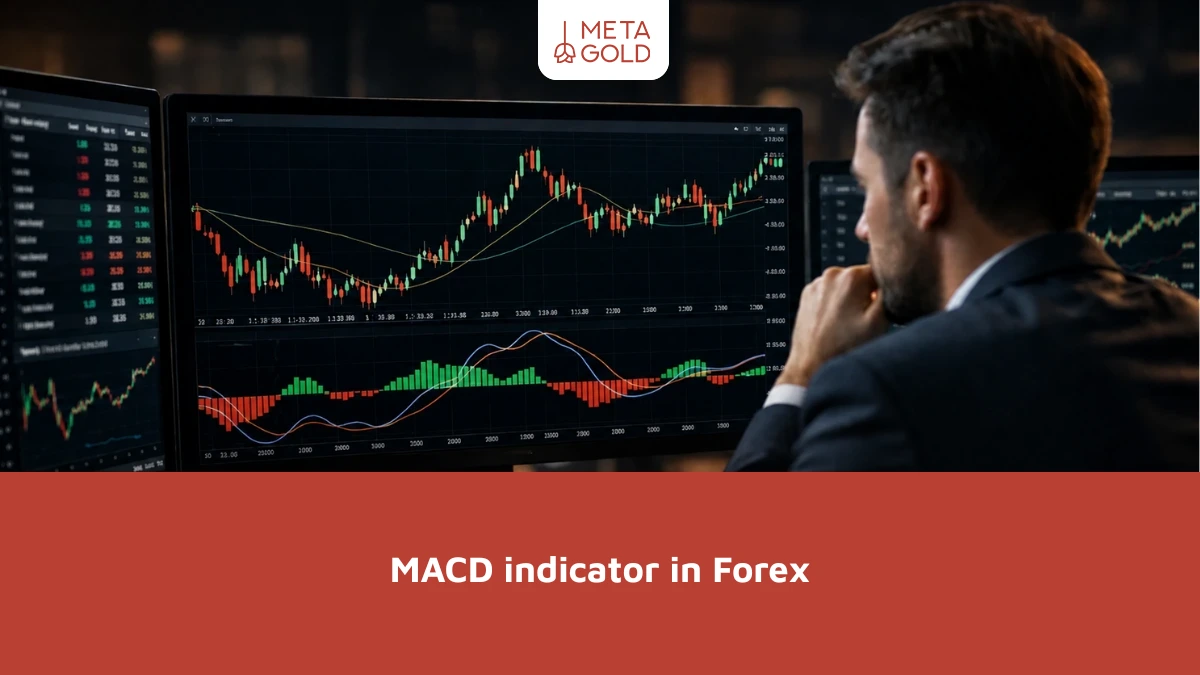
Many traders face a common challenge when using indicators: receiving a lot of signals but making poor decisions. The MACD strategy is one tool that, if understood and used correctly, can provide a clearer view of the market trend and momentum. In this article, we took a step-by-step look at

