
In financial markets, prices sometimes move sharply higher or lower within a very short period of time. This type of rapid jump usually appears in the form of a very large candle or long wick on the chart and attracts the attention of traders. This sudden movement in the market is called a spike .
A spike usually occurs when a large volume of orders enters the market or important news is released that momentarily changes the balance of supply and demand. That is why when traders observe such a movement, they try to understand whether the fluctuation is just a short-term reaction or could be the beginning of a new price movement.
In this article, we explain what a spike is, how it forms on a chart, and how traders use it in analysis and trading decisions.
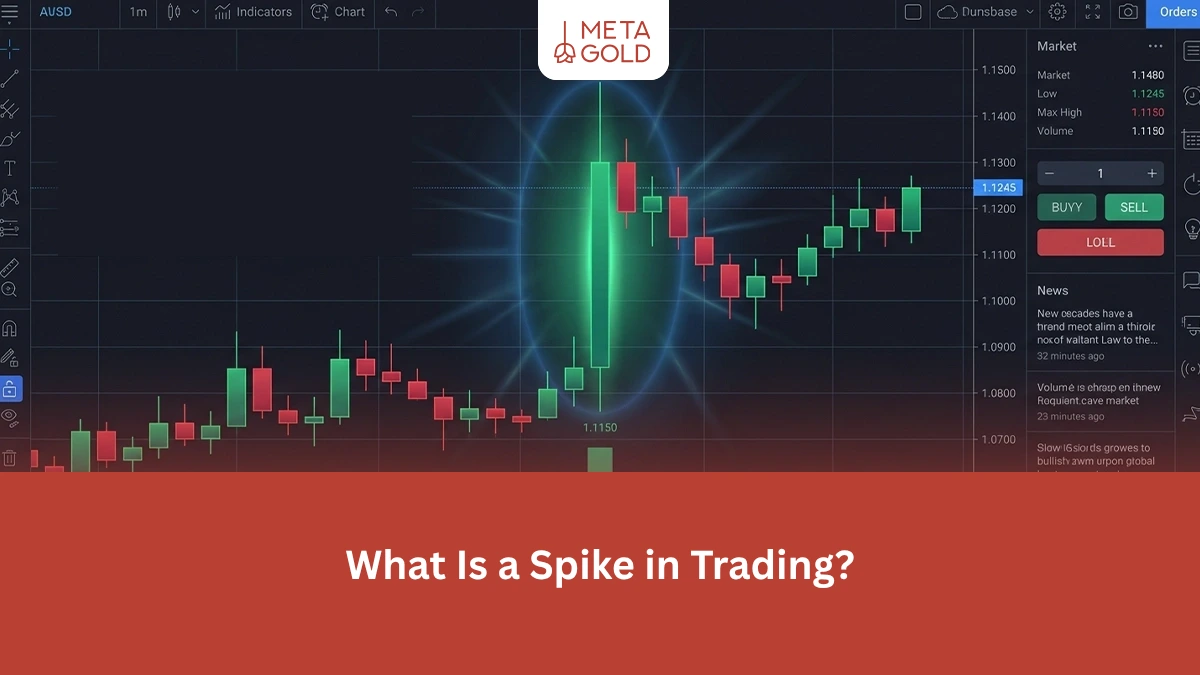
What Is a Spike in Trading? Simple Explanation
In financial markets, a spike is a very rapid and sudden price movement in a short period of time. In such a situation, the price of an asset rises or falls unusually, and this jump is clearly visible on the chart. In simple terms, a spike is a sharp, short-lived price move that is faster and larger than normal market fluctuations.
On a price chart, this movement is often seen as a large candlestick or long wick that is quite distinct among regular candlesticks. Traders often view a spike on the chart as a sign of a sudden influx of trading volume or a rapid shift in the balance between buyers and sellers.
For this reason, in technical analysis, examining this type of movement can provide clues about market behavior and the buying or selling power at a particular moment.
What Is a Spike Candle and What Does It Look Like on a Chart?
On price charts, a spike usually appears as an unusual candlestick that is much larger than the surrounding candles. Such a candlestick is called a spike candlestick. This candlestick shows that there has been a sudden increase in buying or selling pressure in a short period of time.
A spike candle may have a large body or appear as a long wick at the top or bottom of the candle. In either case, the movement indicates a rapid swing in the market that attracts traders’ attention.
Usually, when trading volume increases or important news is released, the probability of such a candle forming on the chart increases. For this reason, many traders, when observing this candle, examine the price behavior in subsequent candles more carefully.
Types of Spikes in Financial Markets
Spikes don’t always appear in the same way and can take different forms depending on the direction of the price movement. Understanding these patterns helps traders better understand whether the market is dominated by buyers or sellers at that moment.
Bullish Spike
In this case, the price suddenly increases at a very fast rate. This movement usually occurs when there is a sudden increase in buying pressure, for example, after a positive news release or a large volume of buy orders.
Bearish Spike
A bearish spike occurs when the price drops rapidly. This type of move is often caused by intense selling pressure, liquidation of trades, or negative news in the market.
Reversal Spike
Sometimes, after a quick spike, the price quickly returns to its previous range. In this case, the spike is more of a short-term market reaction and does not necessarily mean the start of a new trend.
What is a Spike in Forex?
In the Forex market, a spike is usually seen when important news is released or a large volume of orders enter the market in a short period of time. In such situations, the price may suddenly move several pips, creating a sharp jump on the chart.
One of the most common times for spikes to occur in Forex is when important economic data is released, such as interest rates, employment reports, or inflation. At these moments, traders react quickly, causing the price to move up or down rapidly.
For this reason, many traders monitor the market more closely before major news releases. Some even use strategies such as news trading to take advantage of the extreme volatility that results from such news.
What is a Spike in Cryptocurrency?
In the cryptocurrency market, too, sometimes the price of a cryptocurrency will experience a sharp jump or drop in a short period of time. This type of sudden movement on the chart is what is called a spike. Due to the higher volatility of this market, such movements are seen more often in crypto than in many other markets.
Spikes in cryptocurrency typically occur when a large volume of orders enter the market or large traders make heavy buys or sells. Liquidation of leveraged trades can also cause rapid and sharp price movements.
For this reason, when traders observe such a jump on the chart, in addition to examining the market structure, they also pay attention to factors such as trading volume and the behavior of large market players.
How to Recognize a Spike on a Chart?
It is usually not difficult to spot a spike on a price chart, as the movement is much faster and larger than normal market fluctuations. Traders can identify this type of movement on a chart by looking at the candlestick structure and price action.
To identify a spike in a chart, these signs are usually observed:
- Very large candle compared to previous candles
- Long wick at the top or bottom of the candle
- Sudden increase in trading volume
- Rapid price movement in a short period of time
- A rapid breakdown of an important level such as support or resistance
Examining these signs helps traders understand whether the movement is a real spike or just a normal fluctuation in the market.
Spike Trading Strategies in Technical Analysis
Spikes can provide trading opportunities for some traders, but using them requires careful consideration and analysis of market conditions. Traders usually analyze this type of move alongside key levels and subsequent candlestick behavior to make a more informed decision.
Some common ways to use spikes in trading include:
- Trading on price reversal
Sometimes, after a sharp spike, the price returns to its previous range. Some traders use this retracement to enter. - Trading after price stabilization
If the price stabilizes in the direction of its movement after the spike, it may be a sign of a continuation of the trend. - Combination with support and resistance
When a spike occurs near an important level, it can indicate the market’s reaction to that level and provide a significant signal to traders.
Common Mistakes When Trading Spikes
While spikes can create trading opportunities, trading without considering market conditions can lead to losses. Many novice traders enter a trade simply by seeing a quick move and ignore other important factors.
Some common mistakes when trading spikes include:
- Immediate entry after the spike without waiting for the price to stabilize
- Trading regardless of news or major market events
- Ignoring support and resistance levels
- Not using a stop-loss
- Trading in illiquid markets
For this reason, it is best to always examine the spike alongside overall market conditions, trading volume, and important price levels.
Final Thoughts on Spike Trading
A spike is a rapid and noticeable movement in a price chart, usually caused by a sudden surge in trading volume or the release of important news. This movement can appear as a sharp jump or drop in a short period of time, attracting the attention of traders.
While observing spikes can provide clues to momentary market changes, it is not logical to base decisions solely on them. The best approach is to examine such movements alongside factors such as support and resistance levels, trading volume, and overall market conditions for a more accurate analysis.
FAQ
What is a spike in trading?
A spike is a sudden and strong price movement in a short period of time. This movement is usually caused by a large volume of orders entering the market or the release of important news.
What does a spike mean in technical analysis?
In technical analysis, a spike indicates a sudden increase in buying or selling pressure. Traders use this movement to gauge the market reaction and the strength of buyers or sellers.
When does a spike occur in Forex?
In the forex market, spikes are often seen when important economic news is released, such as interest rates, employment reports, or inflation data.
Why are spikes common in cryptocurrency?
The crypto market is more prone to rapid and sudden price movements due to high volatility, leveraged trading, and the activity of large traders.
Is it possible to trade based on spikes only?
No. It is best to examine the spike alongside tools such as support and resistance, trading volume, and overall market conditions to make a more accurate trading decision.