Understanding CFD trading can be difficult for beginners and even intermediate traders, especially when leverage, margin, and forex come into play. Many people assume that by purchasing a CFD they are owning an asset, when in reality the nature of this instrument is completely different. If you are wondering how
Imagine you are looking at a price chart; the market is constantly moving up and down, and finding important areas to enter or exit a trade is not an easy task. In such situations, technical analysis tools can act as a roadmap. One such useful tool is the Fibonacci channel;
Imagine you have opened a chart and the price is moving rapidly, but one key question comes to mind: will this strong move continue or is it just a short-term fluctuation? In such a situation, tools that can show the momentum and strength of the price movement play a very
In financial markets, sometimes a candle appears on the chart that is different from the others; it has a larger body and indicates that buyers or sellers have entered the market with strength. In technical analysis, traders often refer to this type of candle as a momentum candle; a candle

When analyzing market price movements, you may notice that a trend suddenly gains strength or, conversely, stalls and reverses. In such circumstances, the factor behind these changes is “momentum”; a force that can accelerate or dampen price movements. In this article, we will explain what momentum is and how it
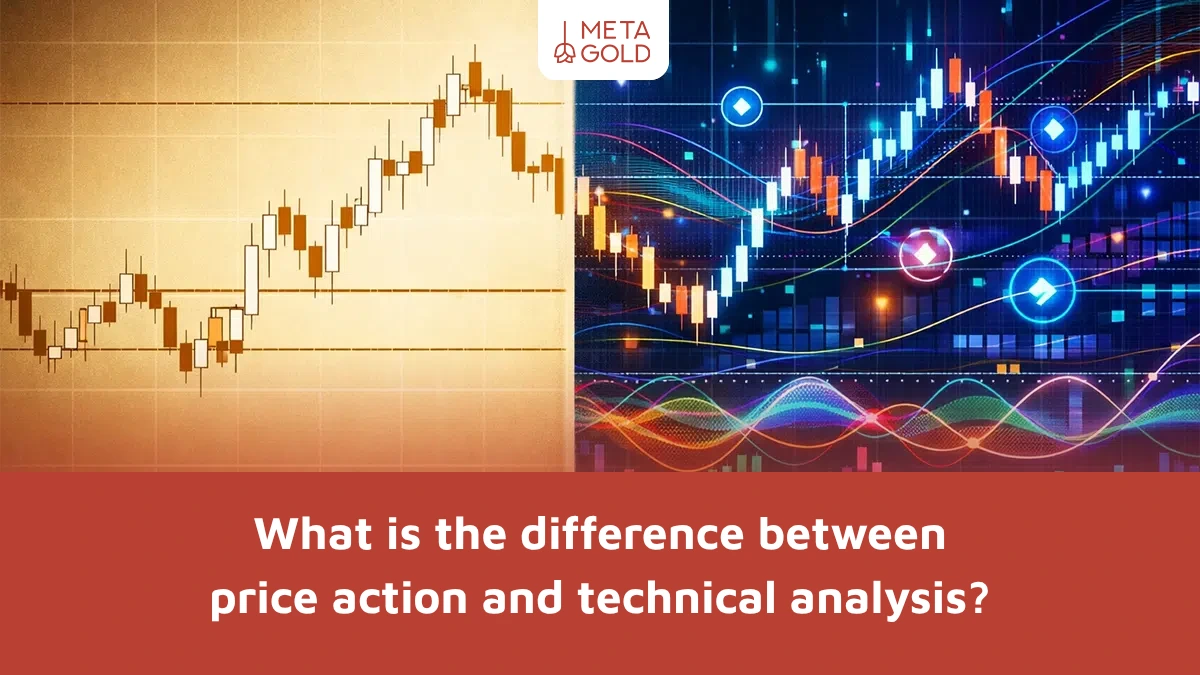
If you are new to trading, you have probably started looking for ways to analyze the market. As you learn, you will likely come across two common terms: price action and technical analysis. But soon you will wonder: what is the difference between these two approaches? In reality, many traders
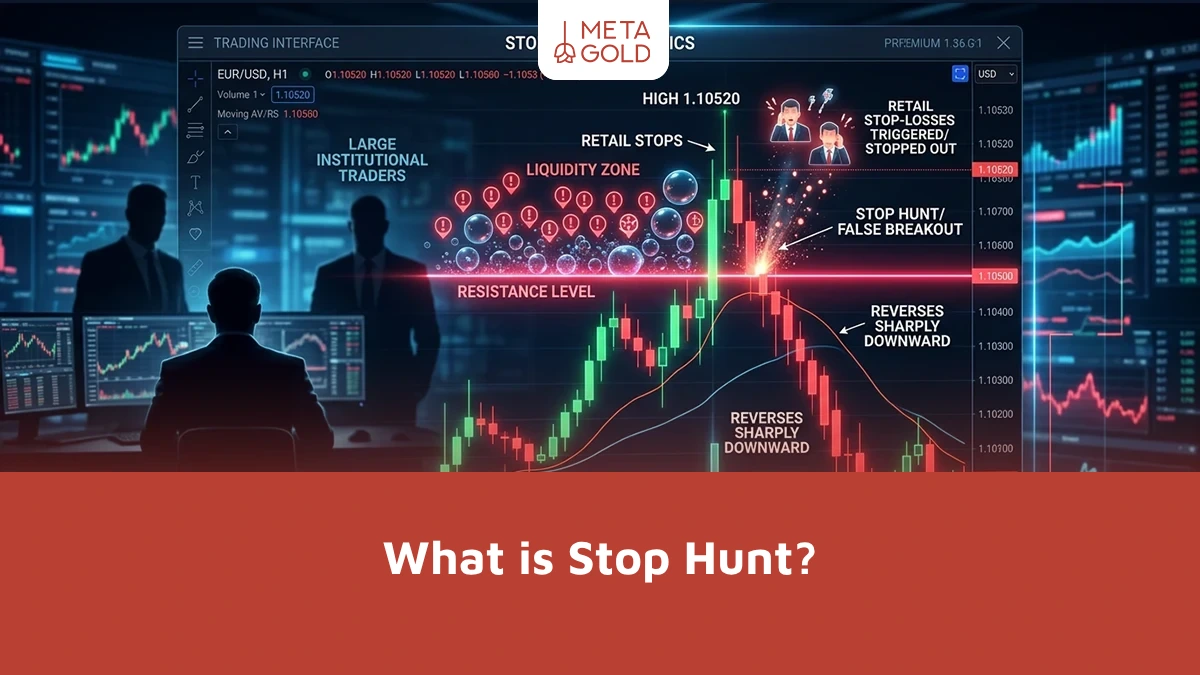
In financial markets, sometimes the price briefly breaks a support or resistance level just before a strong move begins, triggering many traders’ stop-loss orders, but then immediately resumes its original path. This market behavior is called stop hunting. Stop hunting occurs when price moves into an area with a large
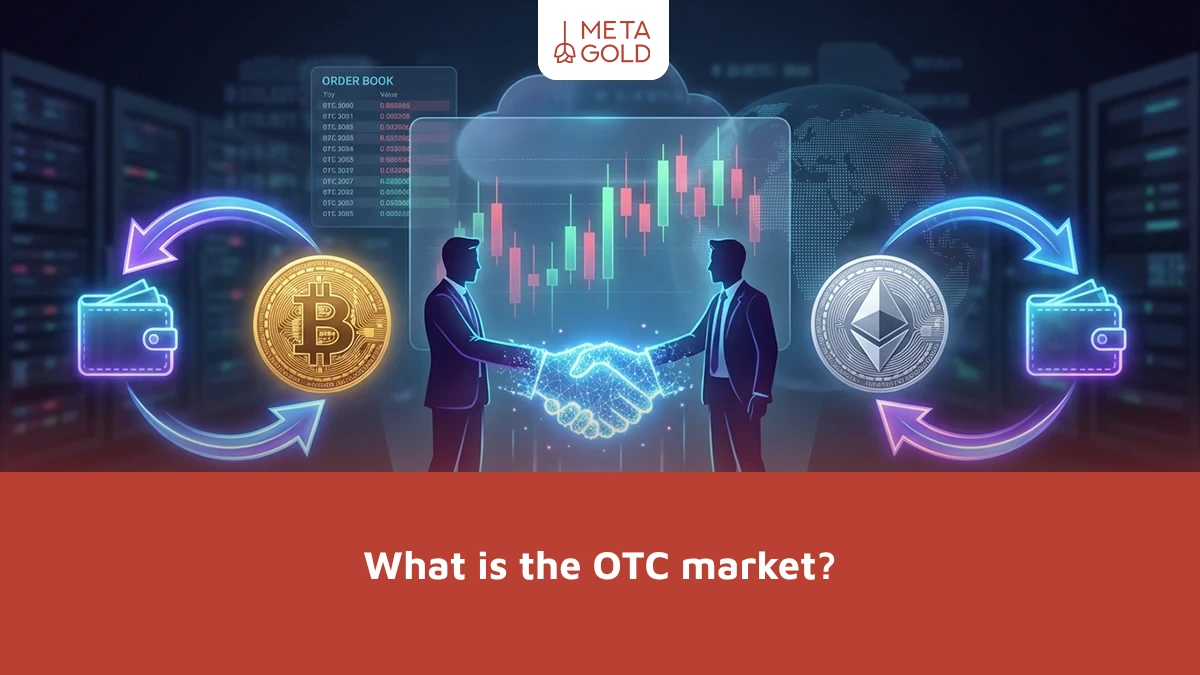
The cryptocurrency market is not limited to buying and selling on exchanges. In addition to regular trading, there are other ways to trade, one of the most important of which is the OTC market. In this type of market, transactions are carried out outside the general order book of exchanges,
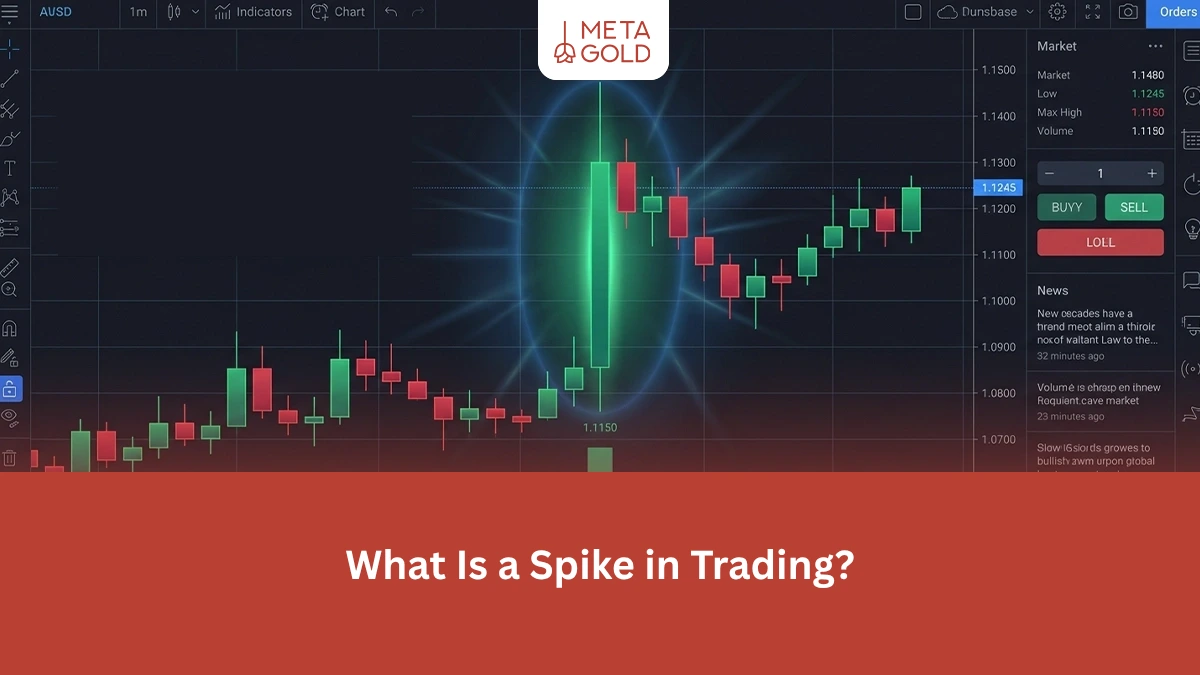
In financial markets, prices sometimes move sharply higher or lower within a very short period of time. This type of rapid jump usually appears in the form of a very large candle or long wick on the chart and attracts the attention of traders. This sudden movement in the market
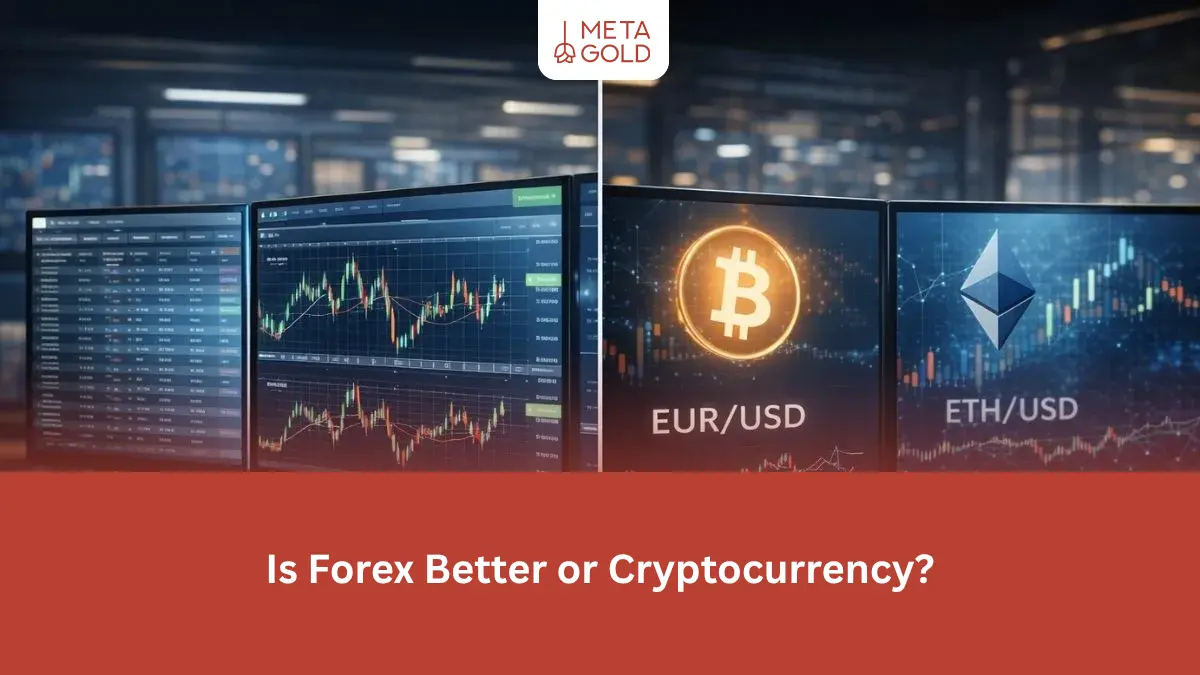
Choosing between the Forex and Cryptocurrency markets is one of the main challenges for people who are planning to enter the world of trading or investing. Both markets provide the opportunity to earn money, but they have fundamental differences in terms of structure, risk level, price volatility and trading methods.
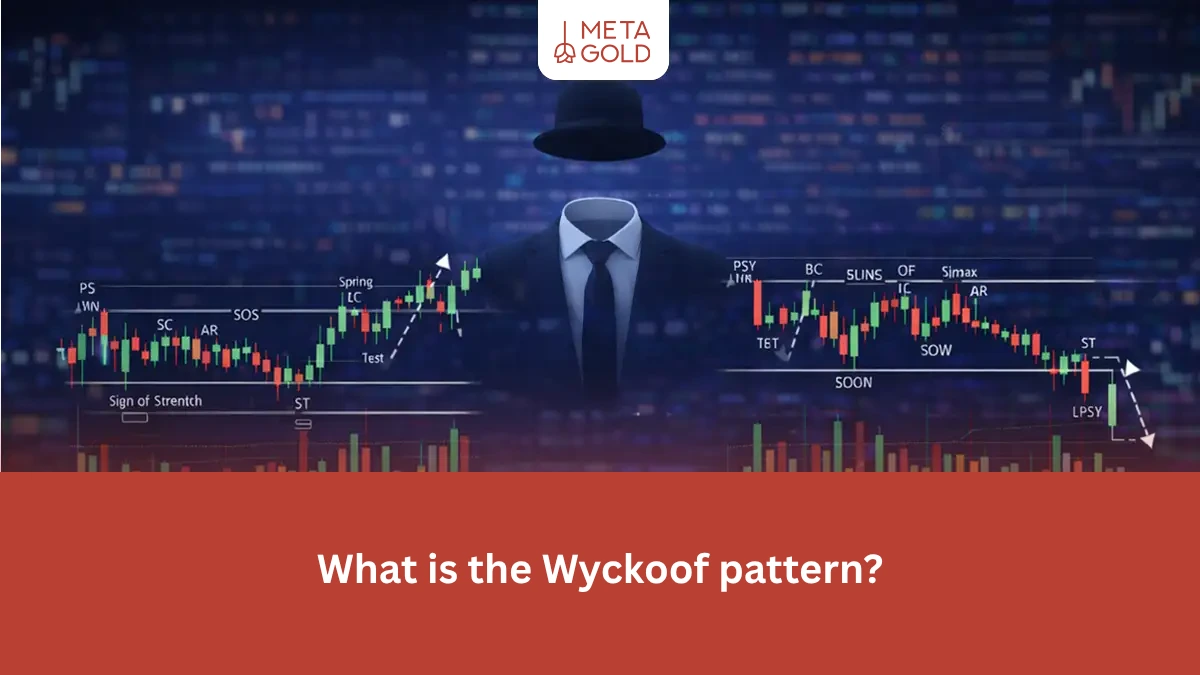
If you are wondering what the Wyckoff Method is, the short answer is: Wyckoff is a behavioral framework for chart reading that helps you understand what stage of its cycle the market is in—accumulation, growth, distribution, or decline—and why price is reacting within ranges. In this Wyckoff method tutorial, concepts
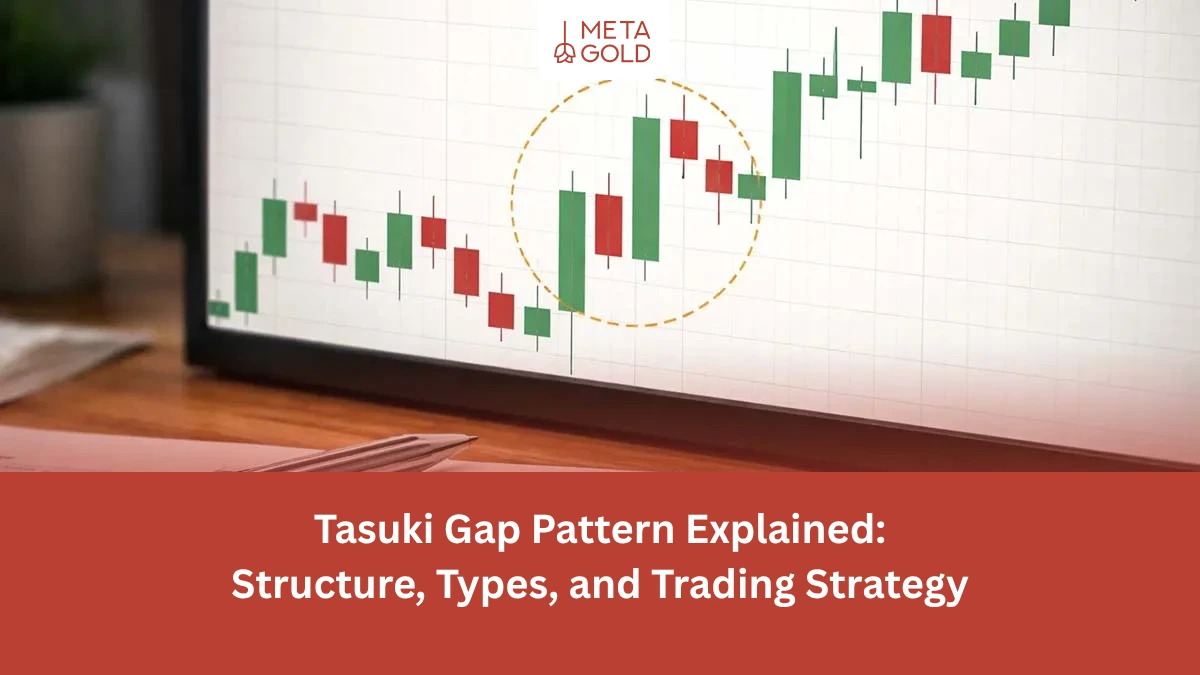
Traders often wonder whether a recent correction signals the end of a strong move or is merely a temporary pause. The Tasuki Gap Pattern in technical analysis was developed to help answer this question. By combining a price gap and an incomplete correction, this pattern can provide a clue about

