


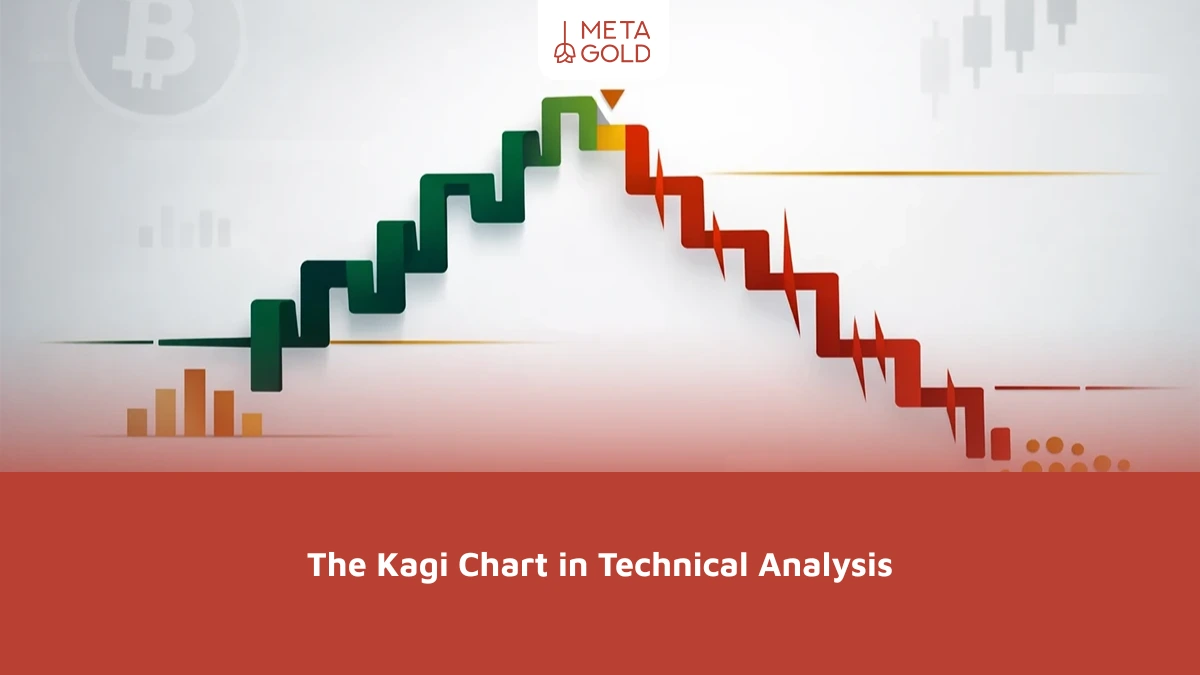
The Kagi chart is one of the distinctive tools in technical analysis; it differs from common charts in that it does not rely on the time factor, but focuses solely on price changes. This feature helps reduce market noise and reveal the primary trend more clearly, while also highlighting the
May 9, 2026
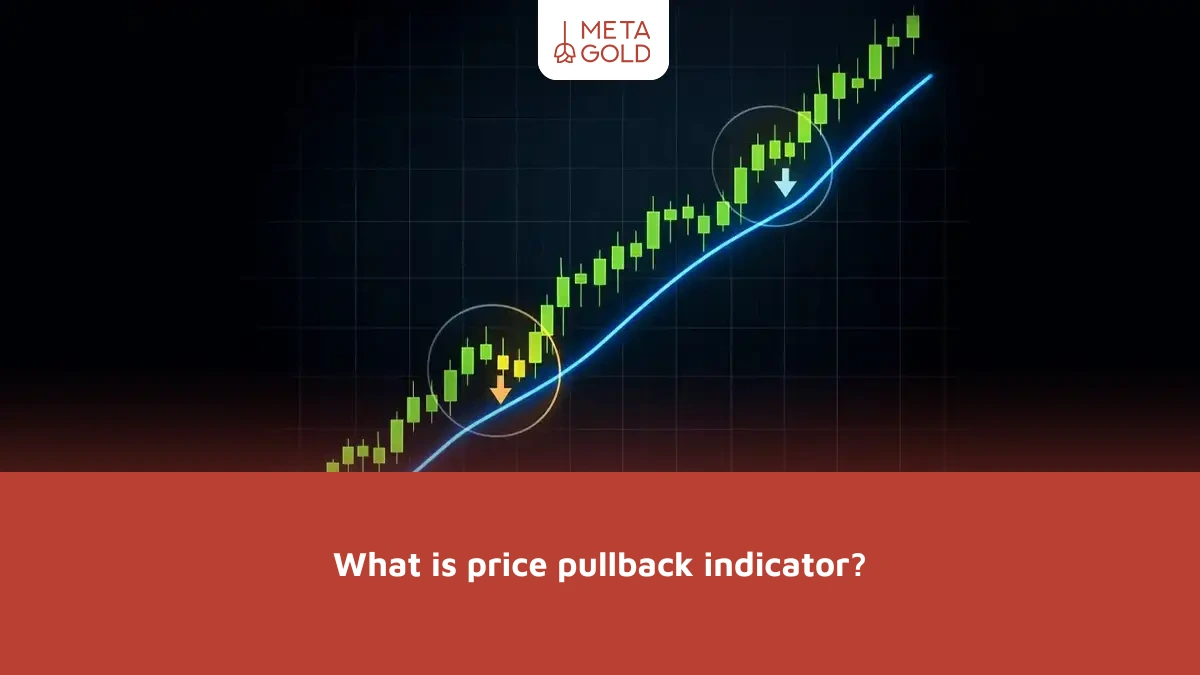
In financial markets, the Pullback Indicator is a technical analysis tool that helps traders identify temporary price corrections within a trend, thereby enabling them to make more rational and accurate entry decisions. A pullback occurs when, following an upward or downward trend, the price temporarily retraces to a significant level,
May 8, 2026

The best time frame for futures trading is not the same for every trader; it depends on trading style, risk tolerance, and asset type. This guide explores key factors in choosing a time frame, suitable ranges for scalping, day trading, and swing trading, and the role of multi-time-frame analysis.
May 8, 2026

The Ichimoku indicator is one of the most comprehensive and widely used tools in technical analysis. It is used to identify market trends, determine support and resistance levels, and measure the strength of price movements. This indicator combines several lines and the Kumo cloud, giving traders a more comprehensive view
May 7, 2026

Pivot points are key chart levels where price may reverse, pause, or continue its movement. Traders use them to spot support and resistance, plan entries and exits, and analyze price action more clearly, especially in Forex markets.
May 7, 2026
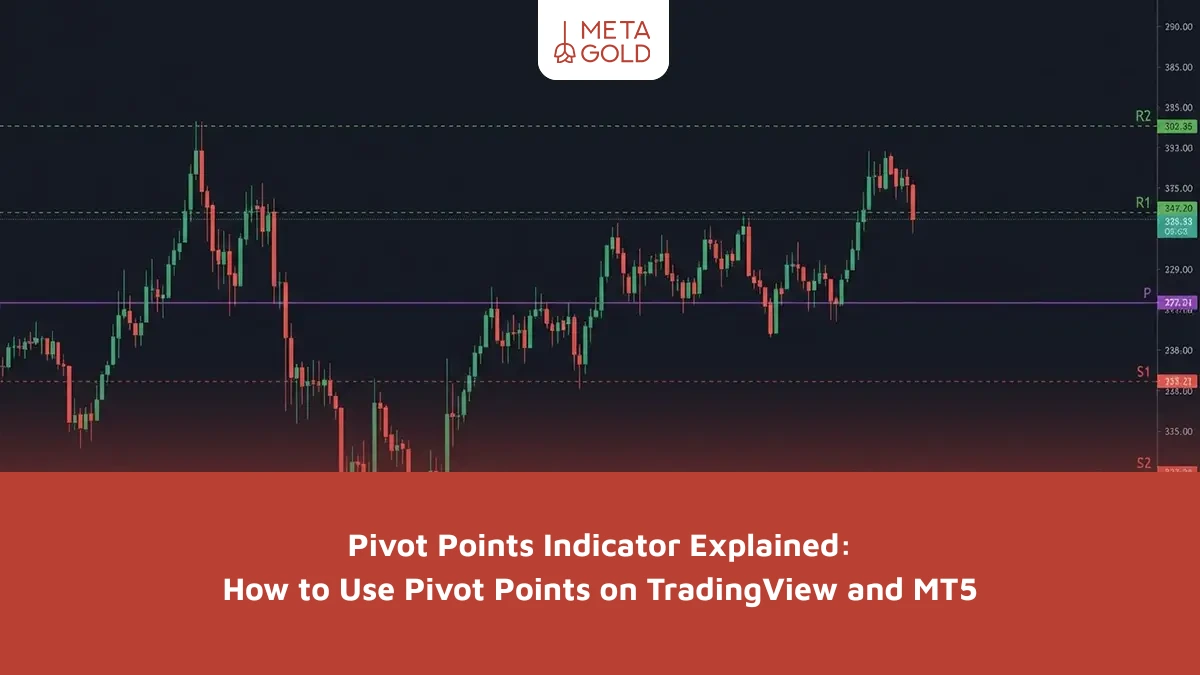
Pivot Points are a technical analysis tool that helps traders identify support and resistance levels using historical price data. They are mainly used in short-term trading to find trends and potential entry and exit points. This guide explains Pivot Point calculations, applications, and usage on TradingView and MetaTrader 5 platforms.
May 6, 2026

